PrecisionFDA
Truth Challenge
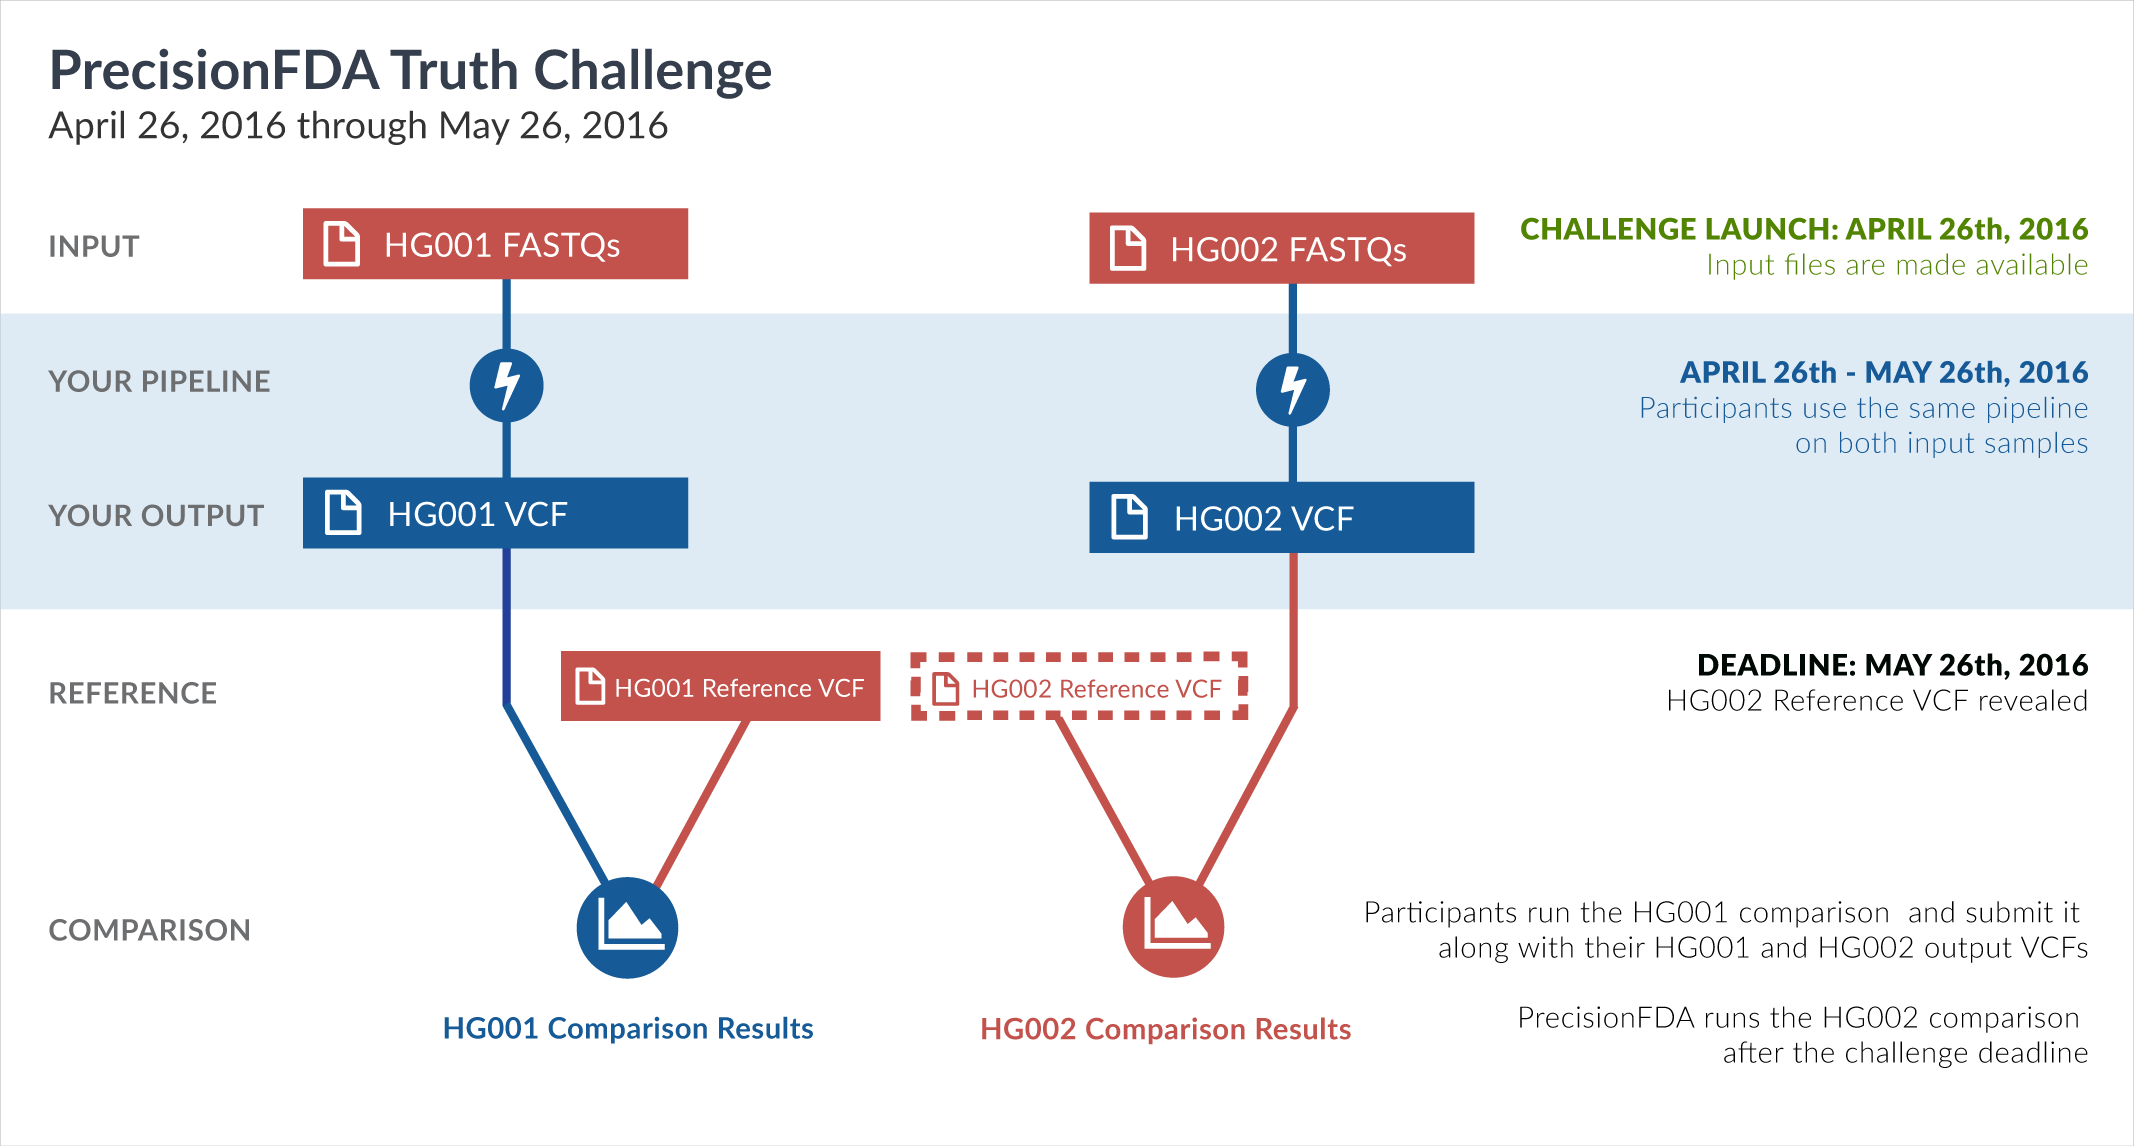
Engage and improve DNA test results with our community challenges
Explore HG002 comparison results
Use this interactive explorer to filter all results across submission entries and multiple dimensions.
| Entry | Type | Subtype | Subset | Genotype | F-score | Recall | Precision | Frac_NA | Truth TP | Truth FN | Query TP | Query FP | FP gt | % FP ma | |
|---|---|---|---|---|---|---|---|---|---|---|---|---|---|---|---|
|
24151-24200 / 86044 show all | |||||||||||||||
| astatham-gatk | SNP | ti | map_l125_m2_e0 | hetalt | 100.0000 | 100.0000 | 100.0000 | 70.0000 | 24 | 0 | 24 | 0 | 0 | ||
| astatham-gatk | SNP | ti | map_l125_m2_e0 | homalt | 99.4872 | 99.0755 | 99.9023 | 65.7910 | 11253 | 105 | 11253 | 11 | 10 | 90.9091 | |
| asubramanian-gatk | INDEL | * | map_l125_m2_e0 | * | 91.1937 | 86.7486 | 96.1190 | 97.1265 | 1905 | 291 | 1907 | 77 | 8 | 10.3896 | |
| asubramanian-gatk | INDEL | * | map_l125_m2_e0 | het | 88.2149 | 83.1057 | 93.9935 | 92.2139 | 1156 | 235 | 1158 | 74 | 7 | 9.4595 | |
| asubramanian-gatk | INDEL | * | map_l125_m2_e0 | hetalt | 96.2963 | 92.8571 | 100.0000 | 93.8583 | 39 | 3 | 39 | 0 | 0 | ||
| asubramanian-gatk | INDEL | * | map_l125_m2_e0 | homalt | 96.2060 | 93.0537 | 99.5792 | 87.7027 | 710 | 53 | 710 | 3 | 1 | 33.3333 | |
| asubramanian-gatk | INDEL | C16_PLUS | map_l125_m2_e0 | * | 0.0000 | 0.0000 | 94.1176 | 0 | 0 | 0 | 1 | 0 | 0.0000 | ||
| asubramanian-gatk | INDEL | C16_PLUS | map_l125_m2_e0 | het | 0.0000 | 0.0000 | 92.3077 | 0 | 0 | 0 | 1 | 0 | 0.0000 | ||
| asubramanian-gatk | INDEL | C16_PLUS | map_l125_m2_e0 | hetalt | 0.0000 | 0.0000 | 0.0000 | 0 | 0 | 0 | 0 | 0 | |||
| asubramanian-gatk | INDEL | C16_PLUS | map_l125_m2_e0 | homalt | 0.0000 | 100.0000 | 0 | 0 | 0 | 0 | 0 | ||||
| astatham-gatk | SNP | tv | map_l125_m2_e0 | * | 91.4434 | 84.4502 | 99.6992 | 76.7428 | 13925 | 2564 | 13923 | 42 | 14 | 33.3333 | |
| astatham-gatk | SNP | tv | map_l125_m2_e0 | het | 86.2155 | 76.0103 | 99.5858 | 81.0010 | 7937 | 2505 | 7935 | 33 | 8 | 24.2424 | |
| astatham-gatk | SNP | tv | map_l125_m2_e0 | hetalt | 98.3051 | 96.6667 | 100.0000 | 75.6303 | 29 | 1 | 29 | 0 | 0 | ||
| astatham-gatk | SNP | tv | map_l125_m2_e0 | homalt | 99.4410 | 99.0361 | 99.8492 | 66.8223 | 5959 | 58 | 5959 | 9 | 6 | 66.6667 | |
| asubramanian-gatk | INDEL | C1_5 | map_l125_m2_e0 | * | 0.0000 | 0.0000 | 97.0588 | 0 | 0 | 0 | 1 | 0 | 0.0000 | ||
| asubramanian-gatk | INDEL | C1_5 | map_l125_m2_e0 | het | 0.0000 | 100.0000 | 0 | 0 | 0 | 0 | 0 | ||||
| asubramanian-gatk | INDEL | C1_5 | map_l125_m2_e0 | hetalt | 0.0000 | 0.0000 | 0.0000 | 0 | 0 | 0 | 0 | 0 | |||
| asubramanian-gatk | INDEL | C1_5 | map_l125_m2_e0 | homalt | 0.0000 | 0.0000 | 92.3077 | 0 | 0 | 0 | 1 | 0 | 0.0000 | ||
| asubramanian-gatk | INDEL | C6_15 | map_l125_m2_e0 | * | 0.0000 | 0.0000 | 92.8571 | 0 | 0 | 0 | 1 | 0 | 0.0000 | ||
| asubramanian-gatk | INDEL | C6_15 | map_l125_m2_e0 | het | 0.0000 | 0.0000 | 91.6667 | 0 | 0 | 0 | 1 | 0 | 0.0000 | ||
| asubramanian-gatk | INDEL | C6_15 | map_l125_m2_e0 | hetalt | 0.0000 | 0.0000 | 0.0000 | 0 | 0 | 0 | 0 | 0 | |||
| asubramanian-gatk | INDEL | C6_15 | map_l125_m2_e0 | homalt | 0.0000 | 100.0000 | 0 | 0 | 0 | 0 | 0 | ||||
| asubramanian-gatk | INDEL | D16_PLUS | map_l125_m2_e0 | * | 88.8889 | 88.8889 | 88.8889 | 97.7099 | 24 | 3 | 24 | 3 | 0 | 0.0000 | |
| asubramanian-gatk | INDEL | D16_PLUS | map_l125_m2_e0 | het | 87.8049 | 90.0000 | 85.7143 | 97.6325 | 18 | 2 | 18 | 3 | 0 | 0.0000 | |
| asubramanian-gatk | INDEL | D16_PLUS | map_l125_m2_e0 | hetalt | 80.0000 | 66.6667 | 100.0000 | 95.4545 | 2 | 1 | 2 | 0 | 0 | ||
| asubramanian-gatk | INDEL | D16_PLUS | map_l125_m2_e0 | homalt | 100.0000 | 100.0000 | 100.0000 | 98.3871 | 4 | 0 | 4 | 0 | 0 | ||
| anovak-vg | INDEL | I1_5 | map_l125_m2_e0 | * | 59.4733 | 61.3769 | 57.6842 | 87.5801 | 526 | 331 | 548 | 402 | 273 | 67.9104 | |
| anovak-vg | INDEL | I1_5 | map_l125_m2_e0 | het | 49.5663 | 40.2414 | 64.5161 | 91.8362 | 200 | 297 | 220 | 121 | 15 | 12.3967 | |
| anovak-vg | INDEL | I1_5 | map_l125_m2_e0 | hetalt | 0.0000 | 36.8421 | 0.0000 | 0.0000 | 7 | 12 | 0 | 0 | 0 | ||
| anovak-vg | INDEL | I1_5 | map_l125_m2_e0 | homalt | 68.3603 | 93.5484 | 53.8588 | 82.4597 | 319 | 22 | 328 | 281 | 258 | 91.8149 | |
| anovak-vg | SNP | * | map_l125_m2_e0 | * | 81.2942 | 87.1691 | 76.1613 | 76.0893 | 40728 | 5995 | 40268 | 12604 | 2812 | 22.3104 | |
| anovak-vg | SNP | * | map_l125_m2_e0 | het | 77.4707 | 90.4768 | 67.7339 | 78.1138 | 26526 | 2792 | 26255 | 12507 | 2731 | 21.8358 | |
| anovak-vg | SNP | * | map_l125_m2_e0 | hetalt | 0.0000 | 30.0000 | 0.0000 | 0.0000 | 9 | 21 | 0 | 0 | 0 | ||
| anovak-vg | SNP | * | map_l125_m2_e0 | homalt | 89.6412 | 81.6863 | 99.3125 | 67.9435 | 14193 | 3182 | 14013 | 97 | 81 | 83.5052 | |
| anovak-vg | SNP | ti | map_l125_m2_e0 | * | 81.4788 | 86.9291 | 76.6717 | 75.9478 | 26303 | 3955 | 26086 | 7937 | 1770 | 22.3006 | |
| anovak-vg | SNP | ti | map_l125_m2_e0 | het | 77.5170 | 89.8919 | 68.1370 | 78.1191 | 16968 | 1908 | 16853 | 7881 | 1719 | 21.8120 | |
| anovak-vg | SNP | ti | map_l125_m2_e0 | hetalt | 0.0000 | 33.3333 | 0.0000 | 0.0000 | 8 | 16 | 0 | 0 | 0 | ||
| anovak-vg | SNP | ti | map_l125_m2_e0 | homalt | 89.9353 | 82.1183 | 99.3971 | 67.3107 | 9327 | 2031 | 9233 | 56 | 51 | 91.0714 | |
| anovak-vg | INDEL | I6_15 | map_l125_m2_e0 | * | 63.3663 | 60.3774 | 66.6667 | 88.0282 | 32 | 21 | 34 | 17 | 6 | 35.2941 | |
| anovak-vg | INDEL | I6_15 | map_l125_m2_e0 | het | 53.8462 | 46.6667 | 63.6364 | 87.4046 | 14 | 16 | 21 | 12 | 2 | 16.6667 | |
| anovak-vg | INDEL | I6_15 | map_l125_m2_e0 | hetalt | 0.0000 | 62.5000 | 0.0000 | 0.0000 | 5 | 3 | 0 | 0 | 0 | ||
| anovak-vg | INDEL | I6_15 | map_l125_m2_e0 | homalt | 78.7879 | 86.6667 | 72.2222 | 89.0244 | 13 | 2 | 13 | 5 | 4 | 80.0000 | |
| anovak-vg | SNP | tv | map_l125_m2_e0 | * | 80.8739 | 87.5311 | 75.1578 | 76.3071 | 14433 | 2056 | 14410 | 4763 | 1075 | 22.5698 | |
| anovak-vg | SNP | tv | map_l125_m2_e0 | het | 77.3239 | 91.5342 | 66.9329 | 78.0559 | 9558 | 884 | 9554 | 4720 | 1043 | 22.0975 | |
| anovak-vg | SNP | tv | map_l125_m2_e0 | hetalt | 0.0000 | 30.0000 | 0.0000 | 0.0000 | 9 | 21 | 0 | 0 | 0 | ||
| anovak-vg | SNP | tv | map_l125_m2_e0 | homalt | 89.0712 | 80.8709 | 99.1223 | 69.1421 | 4866 | 1151 | 4856 | 43 | 32 | 74.4186 | |
| astatham-gatk | INDEL | * | map_l125_m2_e0 | * | 96.5138 | 95.1275 | 97.9410 | 89.1008 | 2089 | 107 | 2093 | 44 | 9 | 20.4545 | |
| astatham-gatk | INDEL | * | map_l125_m2_e0 | het | 94.9267 | 92.7390 | 97.2201 | 89.8845 | 1290 | 101 | 1294 | 37 | 5 | 13.5135 | |
| astatham-gatk | INDEL | * | map_l125_m2_e0 | hetalt | 97.5610 | 95.2381 | 100.0000 | 93.1507 | 40 | 2 | 40 | 0 | 0 | ||
| astatham-gatk | INDEL | * | map_l125_m2_e0 | homalt | 99.2806 | 99.4758 | 99.0862 | 86.9395 | 759 | 4 | 759 | 7 | 4 | 57.1429 | |