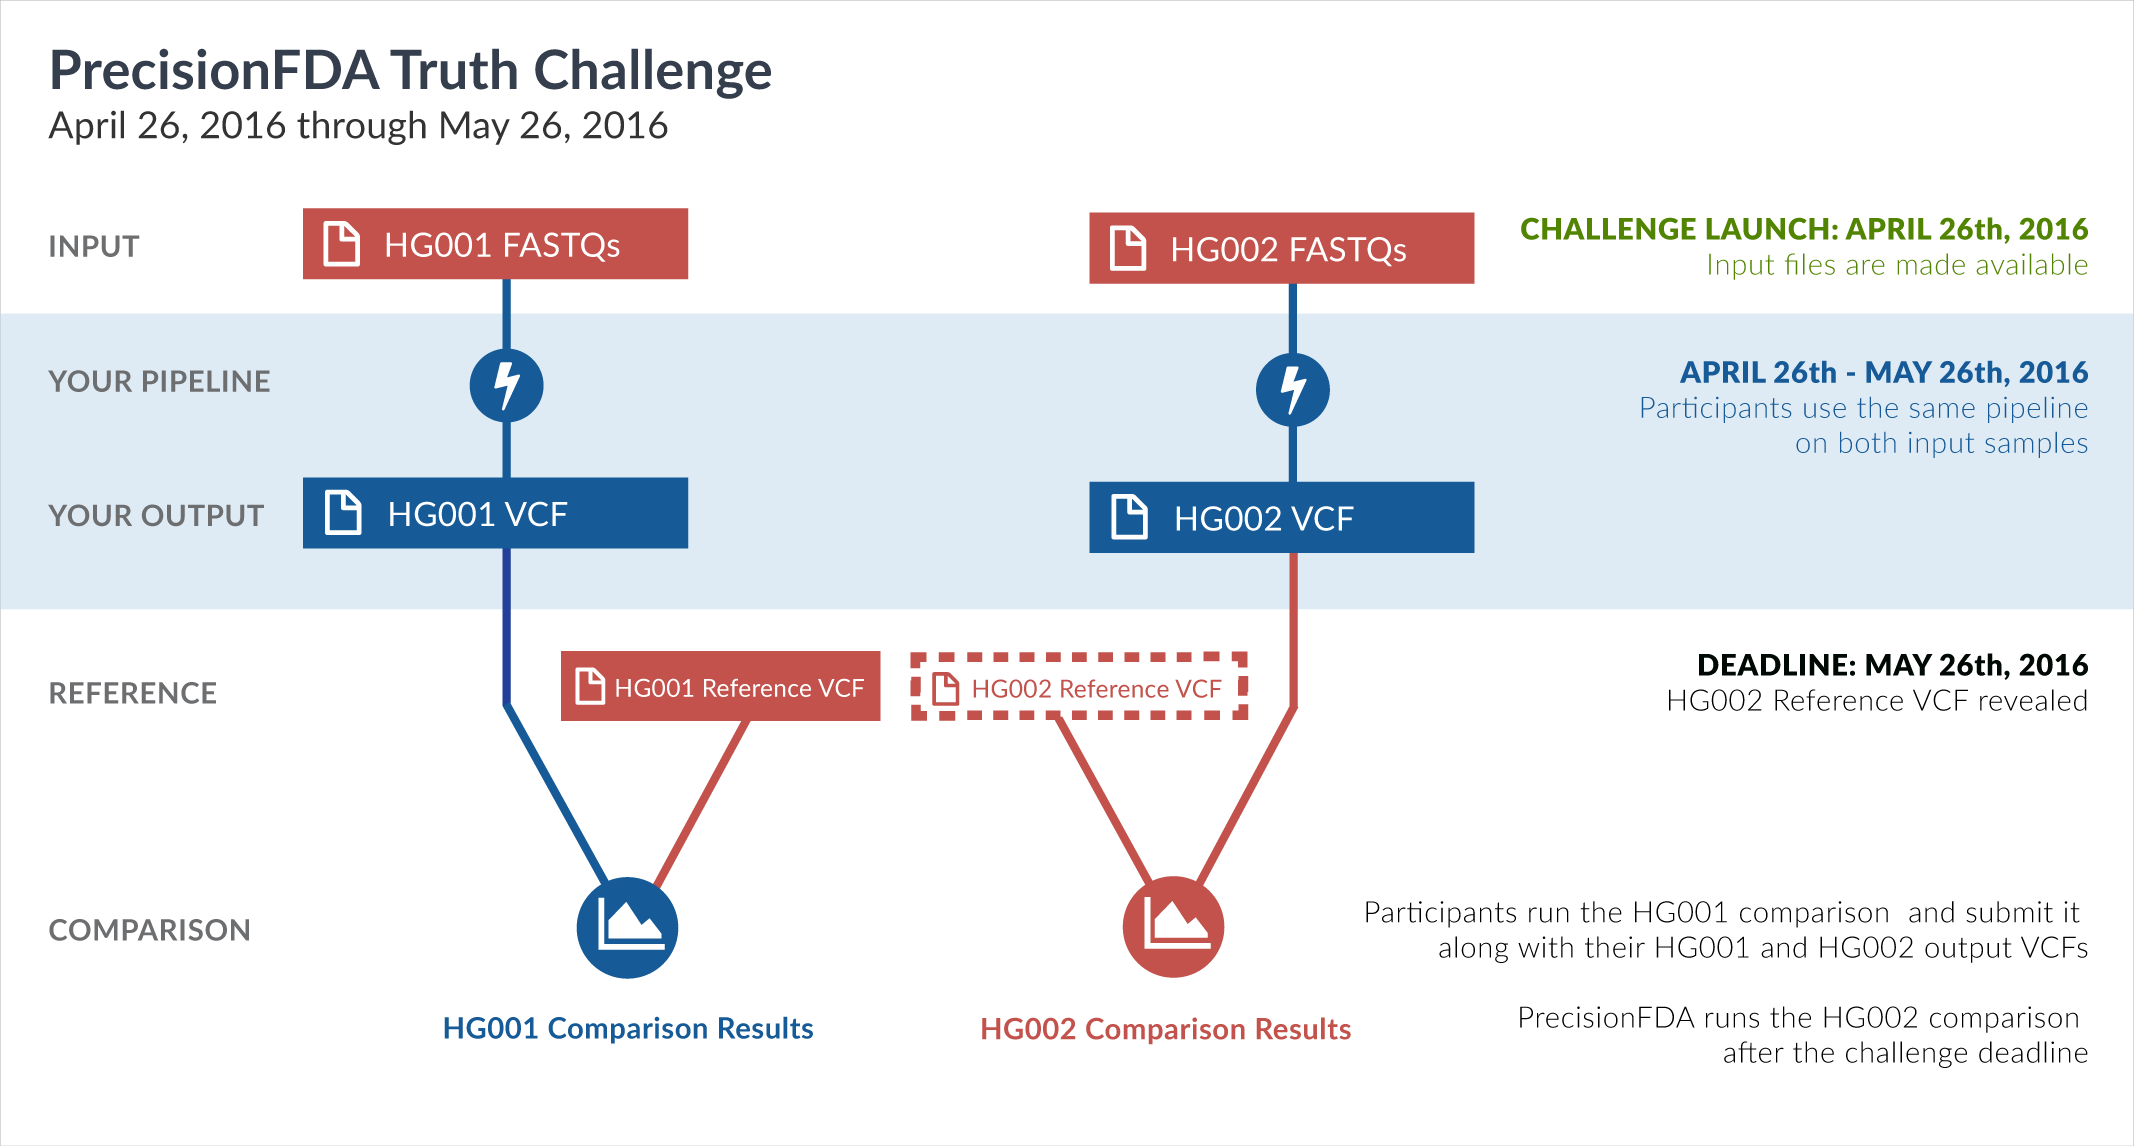
PrecisionFDA
Truth Challenge
Engage and improve DNA test results with our community challenges
Explore HG002 comparison results
Use this interactive explorer to filter all results across submission entries and multiple dimensions.
| Entry | Type | Subtype | Subset | Genotype | F-score | Recall | Precision | Frac_NA | Truth TP | Truth FN | Query TP | Query FP | FP gt | % FP ma | |
|---|---|---|---|---|---|---|---|---|---|---|---|---|---|---|---|
|
56151-56200 / 86044 show all | |||||||||||||||
| astatham-gatk | SNP | tv | map_l100_m2_e1 | hetalt | 98.8235 | 97.6744 | 100.0000 | 71.8121 | 42 | 1 | 42 | 0 | 0 | ||
| astatham-gatk | SNP | tv | map_l100_m2_e1 | homalt | 99.5848 | 99.2797 | 99.8918 | 61.7406 | 9235 | 67 | 9235 | 10 | 6 | 60.0000 | |
| asubramanian-gatk | INDEL | C1_5 | map_l100_m2_e1 | * | 0.0000 | 0.0000 | 98.0769 | 0 | 0 | 0 | 1 | 0 | 0.0000 | ||
| asubramanian-gatk | INDEL | C1_5 | map_l100_m2_e1 | het | 0.0000 | 100.0000 | 0 | 0 | 0 | 0 | 0 | ||||
| asubramanian-gatk | INDEL | C1_5 | map_l100_m2_e1 | hetalt | 0.0000 | 0.0000 | 0.0000 | 0 | 0 | 0 | 0 | 0 | |||
| asubramanian-gatk | INDEL | C1_5 | map_l100_m2_e1 | homalt | 0.0000 | 0.0000 | 95.4545 | 0 | 0 | 0 | 1 | 0 | 0.0000 | ||
| asubramanian-gatk | INDEL | C6_15 | map_l100_m2_e1 | * | 0.0000 | 0.0000 | 88.8889 | 0 | 0 | 0 | 3 | 0 | 0.0000 | ||
| asubramanian-gatk | INDEL | C6_15 | map_l100_m2_e1 | het | 0.0000 | 0.0000 | 86.9565 | 0 | 0 | 0 | 3 | 0 | 0.0000 | ||
| asubramanian-gatk | INDEL | C6_15 | map_l100_m2_e1 | hetalt | 0.0000 | 0.0000 | 0.0000 | 0 | 0 | 0 | 0 | 0 | |||
| asubramanian-gatk | INDEL | C6_15 | map_l100_m2_e1 | homalt | 0.0000 | 100.0000 | 0 | 0 | 0 | 0 | 0 | ||||
| asubramanian-gatk | INDEL | D16_PLUS | map_l100_m2_e1 | * | 87.5000 | 86.5979 | 88.4211 | 95.7342 | 84 | 13 | 84 | 11 | 3 | 27.2727 | |
| asubramanian-gatk | INDEL | D16_PLUS | map_l100_m2_e1 | het | 85.3739 | 88.2353 | 82.6923 | 96.6984 | 45 | 6 | 43 | 9 | 2 | 22.2222 | |
| asubramanian-gatk | INDEL | D16_PLUS | map_l100_m2_e1 | hetalt | 87.3950 | 80.0000 | 96.2963 | 79.2308 | 24 | 6 | 26 | 1 | 1 | 100.0000 | |
| asubramanian-gatk | INDEL | D16_PLUS | map_l100_m2_e1 | homalt | 93.7500 | 93.7500 | 93.7500 | 96.9349 | 15 | 1 | 15 | 1 | 0 | 0.0000 | |
| asubramanian-gatk | INDEL | C16_PLUS | map_l100_m2_e1 | * | 0.0000 | 0.0000 | 97.8723 | 0 | 0 | 0 | 1 | 0 | 0.0000 | ||
| asubramanian-gatk | INDEL | C16_PLUS | map_l100_m2_e1 | het | 0.0000 | 0.0000 | 96.9697 | 0 | 0 | 0 | 1 | 0 | 0.0000 | ||
| asubramanian-gatk | INDEL | C16_PLUS | map_l100_m2_e1 | hetalt | 0.0000 | 100.0000 | 0 | 0 | 0 | 0 | 0 | ||||
| asubramanian-gatk | INDEL | C16_PLUS | map_l100_m2_e1 | homalt | 0.0000 | 100.0000 | 0 | 0 | 0 | 0 | 0 | ||||
| astatham-gatk | SNP | ti | map_l100_m2_e1 | * | 92.0971 | 85.4623 | 99.8489 | 69.7778 | 42291 | 7194 | 42284 | 64 | 36 | 56.2500 | |
| astatham-gatk | SNP | ti | map_l100_m2_e1 | het | 87.0268 | 77.1576 | 99.7911 | 74.6941 | 23888 | 7072 | 23881 | 50 | 23 | 46.0000 | |
| astatham-gatk | SNP | ti | map_l100_m2_e1 | hetalt | 100.0000 | 100.0000 | 100.0000 | 69.0000 | 31 | 0 | 31 | 0 | 0 | ||
| astatham-gatk | SNP | ti | map_l100_m2_e1 | homalt | 99.6312 | 99.3403 | 99.9239 | 59.5512 | 18372 | 122 | 18372 | 14 | 13 | 92.8571 | |
| asubramanian-gatk | INDEL | * | map_l100_m2_e1 | * | 92.1115 | 87.8860 | 96.7638 | 96.1058 | 3301 | 455 | 3319 | 111 | 17 | 15.3153 | |
| asubramanian-gatk | INDEL | * | map_l100_m2_e1 | het | 89.6239 | 84.6778 | 95.1836 | 90.0945 | 1984 | 359 | 1996 | 101 | 13 | 12.8713 | |
| asubramanian-gatk | INDEL | * | map_l100_m2_e1 | hetalt | 94.5063 | 90.9091 | 98.4000 | 87.8758 | 120 | 12 | 123 | 2 | 1 | 50.0000 | |
| asubramanian-gatk | INDEL | * | map_l100_m2_e1 | homalt | 96.3001 | 93.4426 | 99.3377 | 85.6787 | 1197 | 84 | 1200 | 8 | 3 | 37.5000 | |
| astatham-gatk | INDEL | D16_PLUS | map_l100_m2_e1 | * | 89.3401 | 90.7216 | 88.0000 | 95.2584 | 88 | 9 | 88 | 12 | 4 | 33.3333 | |
| astatham-gatk | INDEL | D16_PLUS | map_l100_m2_e1 | het | 86.8949 | 94.1176 | 80.7018 | 96.1039 | 48 | 3 | 46 | 11 | 4 | 36.3636 | |
| astatham-gatk | INDEL | D16_PLUS | map_l100_m2_e1 | hetalt | 90.9091 | 83.3333 | 100.0000 | 78.2258 | 25 | 5 | 27 | 0 | 0 | ||
| astatham-gatk | INDEL | D16_PLUS | map_l100_m2_e1 | homalt | 93.7500 | 93.7500 | 93.7500 | 96.9349 | 15 | 1 | 15 | 1 | 0 | 0.0000 | |
| astatham-gatk | INDEL | I16_PLUS | map_l100_m2_e1 | * | 86.7925 | 88.4615 | 85.1852 | 96.0813 | 23 | 3 | 23 | 4 | 1 | 25.0000 | |
| astatham-gatk | INDEL | I16_PLUS | map_l100_m2_e1 | het | 88.8889 | 88.8889 | 88.8889 | 95.1613 | 16 | 2 | 16 | 2 | 1 | 50.0000 | |
| astatham-gatk | INDEL | I16_PLUS | map_l100_m2_e1 | hetalt | 80.0000 | 66.6667 | 100.0000 | 94.1176 | 2 | 1 | 2 | 0 | 0 | ||
| astatham-gatk | INDEL | I16_PLUS | map_l100_m2_e1 | homalt | 83.3333 | 100.0000 | 71.4286 | 97.5265 | 5 | 0 | 5 | 2 | 0 | 0.0000 | |
| astatham-gatk | INDEL | I1_5 | map_l100_m2_e1 | * | 96.5074 | 94.0502 | 99.0964 | 85.4242 | 1312 | 83 | 1316 | 12 | 4 | 33.3333 | |
| astatham-gatk | INDEL | I1_5 | map_l100_m2_e1 | het | 94.3102 | 90.0000 | 99.0541 | 86.9442 | 729 | 81 | 733 | 7 | 0 | 0.0000 | |
| astatham-gatk | INDEL | I1_5 | map_l100_m2_e1 | hetalt | 97.7273 | 95.5556 | 100.0000 | 89.3827 | 43 | 2 | 43 | 0 | 0 | ||
| astatham-gatk | INDEL | I1_5 | map_l100_m2_e1 | homalt | 99.5392 | 100.0000 | 99.0826 | 82.0606 | 540 | 0 | 540 | 5 | 4 | 80.0000 | |
| astatham-gatk | INDEL | I6_15 | map_l100_m2_e1 | * | 96.0352 | 93.9655 | 98.1982 | 88.9442 | 109 | 7 | 109 | 2 | 1 | 50.0000 | |
| astatham-gatk | INDEL | I6_15 | map_l100_m2_e1 | het | 95.0000 | 93.4426 | 96.6102 | 89.4454 | 57 | 4 | 57 | 2 | 1 | 50.0000 | |
| astatham-gatk | INDEL | I6_15 | map_l100_m2_e1 | hetalt | 95.2381 | 90.9091 | 100.0000 | 84.1270 | 20 | 2 | 20 | 0 | 0 | ||
| astatham-gatk | INDEL | I6_15 | map_l100_m2_e1 | homalt | 98.4615 | 96.9697 | 100.0000 | 89.9687 | 32 | 1 | 32 | 0 | 0 | ||
| astatham-gatk | SNP | * | map_l100_m2_e1 | * | 92.0052 | 85.3219 | 99.8246 | 70.5612 | 63767 | 10970 | 63756 | 112 | 52 | 46.4286 | |
| astatham-gatk | SNP | * | map_l100_m2_e1 | het | 86.9224 | 77.0139 | 99.7569 | 75.4083 | 36118 | 10780 | 36107 | 88 | 33 | 37.5000 | |
| astatham-gatk | SNP | * | map_l100_m2_e1 | hetalt | 98.8235 | 97.6744 | 100.0000 | 71.8121 | 42 | 1 | 42 | 0 | 0 | ||
| astatham-gatk | SNP | * | map_l100_m2_e1 | homalt | 99.6157 | 99.3200 | 99.9131 | 60.3111 | 27607 | 189 | 27607 | 24 | 19 | 79.1667 | |
| astatham-gatk | INDEL | D6_15 | map_l100_m2_e1 | * | 96.1609 | 95.6364 | 96.6912 | 87.6307 | 263 | 12 | 263 | 9 | 2 | 22.2222 | |
| astatham-gatk | INDEL | D6_15 | map_l100_m2_e1 | het | 95.2727 | 97.0370 | 93.5714 | 90.2643 | 131 | 4 | 131 | 9 | 2 | 22.2222 | |
| astatham-gatk | INDEL | D6_15 | map_l100_m2_e1 | hetalt | 95.7143 | 91.7808 | 100.0000 | 74.1313 | 67 | 6 | 67 | 0 | 0 | ||
| astatham-gatk | INDEL | D6_15 | map_l100_m2_e1 | homalt | 98.4848 | 97.0149 | 100.0000 | 87.0518 | 65 | 2 | 65 | 0 | 0 | ||