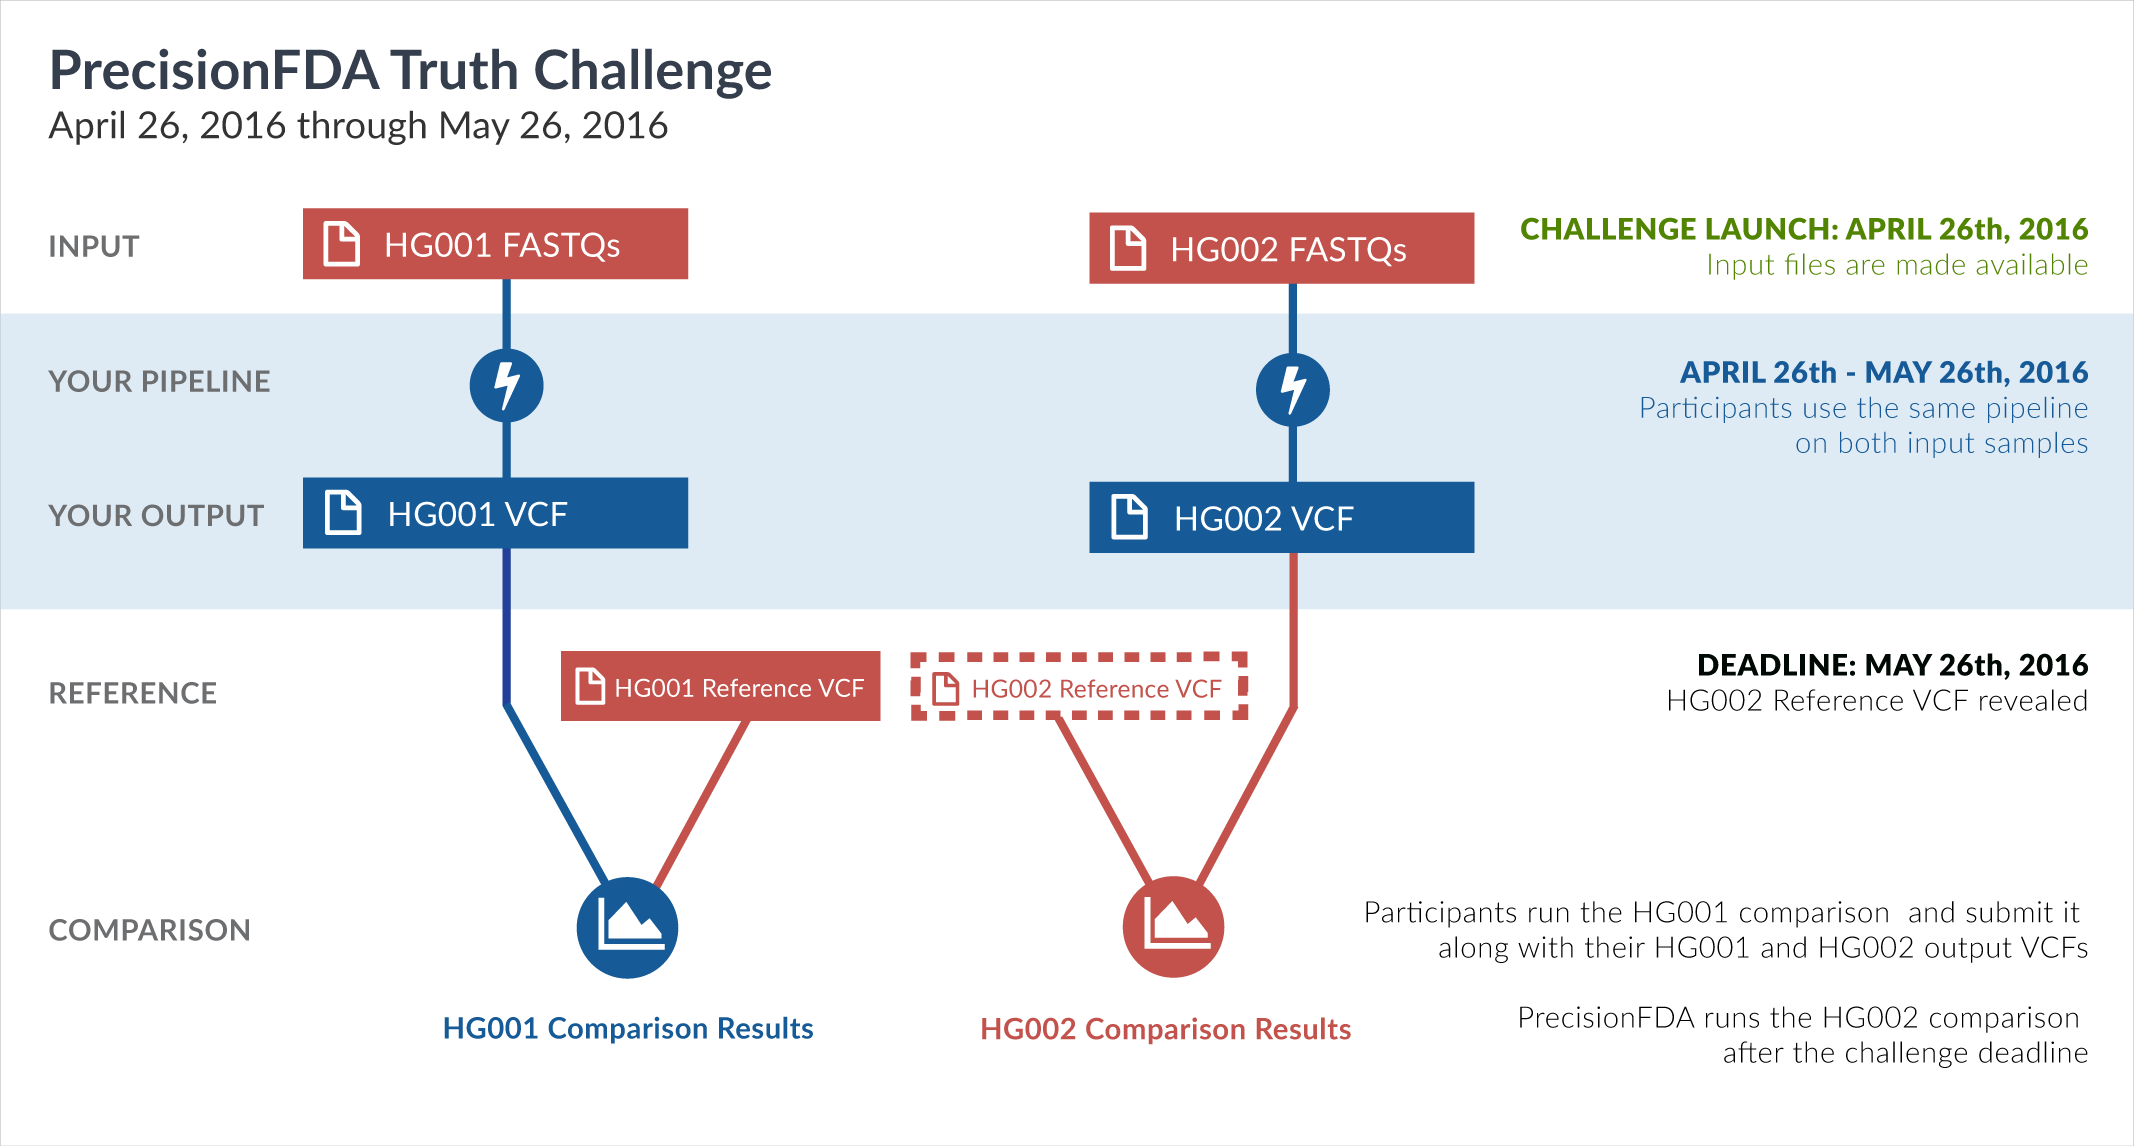
PrecisionFDA
Truth Challenge
Engage and improve DNA test results with our community challenges
Explore HG002 comparison results
Use this interactive explorer to filter all results across submission entries and multiple dimensions.
| Entry | Type | Subtype | Subset | Genotype | F-score | Recall | Precision | Frac_NA | Truth TP | Truth FN | Query TP | Query FP | FP gt | % FP ma | |
|---|---|---|---|---|---|---|---|---|---|---|---|---|---|---|---|
|
56101-56150 / 86044 show all | |||||||||||||||
| anovak-vg | INDEL | I1_5 | map_l100_m2_e1 | * | 57.8586 | 58.9964 | 56.7639 | 84.9109 | 823 | 572 | 856 | 652 | 469 | 71.9325 | |
| anovak-vg | INDEL | I1_5 | map_l100_m2_e1 | het | 47.7657 | 37.9012 | 64.5714 | 90.0794 | 307 | 503 | 339 | 186 | 31 | 16.6667 | |
| anovak-vg | INDEL | I1_5 | map_l100_m2_e1 | hetalt | 0.0000 | 33.3333 | 0.0000 | 0.0000 | 15 | 30 | 0 | 0 | 0 | ||
| anovak-vg | INDEL | I1_5 | map_l100_m2_e1 | homalt | 67.1322 | 92.7778 | 52.5941 | 79.0940 | 501 | 39 | 517 | 466 | 438 | 93.9914 | |
| astatham-gatk | INDEL | C16_PLUS | map_l100_m2_e1 | * | 0.0000 | 0.0000 | 0.0000 | 0 | 0 | 0 | 0 | 0 | |||
| astatham-gatk | INDEL | C16_PLUS | map_l100_m2_e1 | het | 0.0000 | 0.0000 | 0.0000 | 0 | 0 | 0 | 0 | 0 | |||
| astatham-gatk | INDEL | C16_PLUS | map_l100_m2_e1 | hetalt | 0.0000 | 0.0000 | 0.0000 | 0 | 0 | 0 | 0 | 0 | |||
| astatham-gatk | INDEL | C16_PLUS | map_l100_m2_e1 | homalt | 0.0000 | 0.0000 | 0.0000 | 0 | 0 | 0 | 0 | 0 | |||
| astatham-gatk | INDEL | C1_5 | map_l100_m2_e1 | * | 0.0000 | 0.0000 | 0.0000 | 0 | 0 | 0 | 0 | 0 | |||
| astatham-gatk | INDEL | C1_5 | map_l100_m2_e1 | het | 0.0000 | 0.0000 | 0.0000 | 0 | 0 | 0 | 0 | 0 | |||
| astatham-gatk | INDEL | C1_5 | map_l100_m2_e1 | hetalt | 0.0000 | 0.0000 | 0.0000 | 0 | 0 | 0 | 0 | 0 | |||
| astatham-gatk | INDEL | C1_5 | map_l100_m2_e1 | homalt | 0.0000 | 0.0000 | 0.0000 | 0 | 0 | 0 | 0 | 0 | |||
| anovak-vg | SNP | ti | map_l100_m2_e1 | * | 84.6108 | 88.6390 | 80.9329 | 70.4744 | 43863 | 5622 | 43482 | 10244 | 2310 | 22.5498 | |
| anovak-vg | SNP | ti | map_l100_m2_e1 | het | 80.9356 | 90.4328 | 73.2435 | 73.3025 | 27998 | 2962 | 27782 | 10149 | 2220 | 21.8741 | |
| anovak-vg | SNP | ti | map_l100_m2_e1 | hetalt | 0.0000 | 35.4839 | 0.0000 | 0.0000 | 11 | 20 | 0 | 0 | 0 | ||
| anovak-vg | SNP | ti | map_l100_m2_e1 | homalt | 92.0569 | 85.7251 | 99.3985 | 60.4006 | 15854 | 2640 | 15700 | 95 | 90 | 94.7368 | |
| bgallagher-sentieon | INDEL | I6_15 | map_l100_m2_e1 | * | 96.4912 | 94.8276 | 98.2143 | 88.6525 | 110 | 6 | 110 | 2 | 1 | 50.0000 | |
| bgallagher-sentieon | INDEL | I6_15 | map_l100_m2_e1 | het | 95.8678 | 95.0820 | 96.6667 | 88.9706 | 58 | 3 | 58 | 2 | 1 | 50.0000 | |
| bgallagher-sentieon | INDEL | I6_15 | map_l100_m2_e1 | hetalt | 95.2381 | 90.9091 | 100.0000 | 82.9060 | 20 | 2 | 20 | 0 | 0 | ||
| bgallagher-sentieon | INDEL | I6_15 | map_l100_m2_e1 | homalt | 98.4615 | 96.9697 | 100.0000 | 90.1840 | 32 | 1 | 32 | 0 | 0 | ||
| bgallagher-sentieon | SNP | * | map_l100_m2_e1 | * | 99.4314 | 99.5705 | 99.2927 | 67.0857 | 74416 | 321 | 74405 | 530 | 81 | 15.2830 | |
| bgallagher-sentieon | SNP | * | map_l100_m2_e1 | het | 99.2207 | 99.5181 | 98.9251 | 70.1134 | 46672 | 226 | 46661 | 507 | 63 | 12.4260 | |
| bgallagher-sentieon | SNP | * | map_l100_m2_e1 | hetalt | 97.6190 | 95.3488 | 100.0000 | 72.2973 | 41 | 2 | 41 | 0 | 0 | ||
| bgallagher-sentieon | SNP | * | map_l100_m2_e1 | homalt | 99.7911 | 99.6654 | 99.9170 | 60.2187 | 27703 | 93 | 27703 | 23 | 18 | 78.2609 | |
| cchapple-custom | INDEL | * | map_l100_m2_e1 | * | 95.9700 | 96.4324 | 95.5120 | 84.7746 | 3622 | 134 | 3703 | 174 | 52 | 29.8851 | |
| cchapple-custom | INDEL | * | map_l100_m2_e1 | het | 95.2316 | 96.5856 | 93.9150 | 85.7416 | 2263 | 80 | 2454 | 159 | 41 | 25.7862 | |
| cchapple-custom | INDEL | * | map_l100_m2_e1 | hetalt | 0.0000 | 83.3333 | 0.0000 | 0.0000 | 110 | 22 | 0 | 0 | 0 | ||
| cchapple-custom | INDEL | * | map_l100_m2_e1 | homalt | 98.1532 | 97.5020 | 98.8133 | 82.2920 | 1249 | 32 | 1249 | 15 | 11 | 73.3333 | |
| cchapple-custom | INDEL | C16_PLUS | map_l100_m2_e1 | * | 0.0000 | 100.0000 | 0 | 0 | 0 | 0 | 0 | ||||
| cchapple-custom | INDEL | C16_PLUS | map_l100_m2_e1 | het | 0.0000 | 100.0000 | 0 | 0 | 0 | 0 | 0 | ||||
| cchapple-custom | INDEL | C16_PLUS | map_l100_m2_e1 | hetalt | 0.0000 | 0.0000 | 0.0000 | 0 | 0 | 0 | 0 | 0 | |||
| cchapple-custom | INDEL | C16_PLUS | map_l100_m2_e1 | homalt | 0.0000 | 100.0000 | 0 | 0 | 0 | 0 | 0 | ||||
| cchapple-custom | INDEL | C1_5 | map_l100_m2_e1 | * | 0.0000 | 0.0000 | 66.0714 | 95.2421 | 0 | 0 | 37 | 19 | 9 | 47.3684 | |
| cchapple-custom | INDEL | C1_5 | map_l100_m2_e1 | het | 0.0000 | 0.0000 | 58.6957 | 95.0324 | 0 | 0 | 27 | 19 | 9 | 47.3684 | |
| cchapple-custom | INDEL | C1_5 | map_l100_m2_e1 | hetalt | 0.0000 | 0.0000 | 0.0000 | 0 | 0 | 0 | 0 | 0 | |||
| cchapple-custom | INDEL | C1_5 | map_l100_m2_e1 | homalt | 0.0000 | 0.0000 | 100.0000 | 96.0159 | 0 | 0 | 10 | 0 | 0 | ||
| bgallagher-sentieon | SNP | tv | map_l100_m2_e1 | * | 99.3647 | 99.6084 | 99.1222 | 68.5080 | 25184 | 99 | 25180 | 223 | 31 | 13.9013 | |
| bgallagher-sentieon | SNP | tv | map_l100_m2_e1 | het | 99.1255 | 99.5859 | 98.6693 | 71.4407 | 15872 | 66 | 15868 | 214 | 25 | 11.6822 | |
| bgallagher-sentieon | SNP | tv | map_l100_m2_e1 | hetalt | 97.6190 | 95.3488 | 100.0000 | 72.2973 | 41 | 2 | 41 | 0 | 0 | ||
| bgallagher-sentieon | SNP | tv | map_l100_m2_e1 | homalt | 99.7847 | 99.6667 | 99.9030 | 61.6624 | 9271 | 31 | 9271 | 9 | 6 | 66.6667 | |
| bgallagher-sentieon | INDEL | I1_5 | map_l100_m2_e1 | * | 98.9616 | 98.9247 | 98.9986 | 84.3973 | 1380 | 15 | 1384 | 14 | 4 | 28.5714 | |
| bgallagher-sentieon | INDEL | I1_5 | map_l100_m2_e1 | het | 98.6414 | 98.3951 | 98.8889 | 85.5098 | 797 | 13 | 801 | 9 | 0 | 0.0000 | |
| bgallagher-sentieon | INDEL | I1_5 | map_l100_m2_e1 | hetalt | 97.7273 | 95.5556 | 100.0000 | 88.3152 | 43 | 2 | 43 | 0 | 0 | ||
| bgallagher-sentieon | INDEL | I1_5 | map_l100_m2_e1 | homalt | 99.5392 | 100.0000 | 99.0826 | 81.8454 | 540 | 0 | 540 | 5 | 4 | 80.0000 | |
| bgallagher-sentieon | SNP | ti | map_l100_m2_e1 | * | 99.4649 | 99.5494 | 99.3806 | 66.3075 | 49262 | 223 | 49255 | 307 | 50 | 16.2866 | |
| bgallagher-sentieon | SNP | ti | map_l100_m2_e1 | het | 99.2699 | 99.4832 | 99.0575 | 69.3770 | 30800 | 160 | 30793 | 293 | 38 | 12.9693 | |
| bgallagher-sentieon | SNP | ti | map_l100_m2_e1 | hetalt | 98.3607 | 96.7742 | 100.0000 | 69.6970 | 30 | 1 | 30 | 0 | 0 | ||
| bgallagher-sentieon | SNP | ti | map_l100_m2_e1 | homalt | 99.7943 | 99.6648 | 99.9241 | 59.4504 | 18432 | 62 | 18432 | 14 | 12 | 85.7143 | |
| astatham-gatk | SNP | tv | map_l100_m2_e1 | * | 91.8357 | 85.0651 | 99.7773 | 71.9862 | 21507 | 3776 | 21503 | 48 | 16 | 33.3333 | |
| astatham-gatk | SNP | tv | map_l100_m2_e1 | het | 86.7191 | 76.7348 | 99.6902 | 76.6919 | 12230 | 3708 | 12226 | 38 | 10 | 26.3158 | |