PrecisionFDA
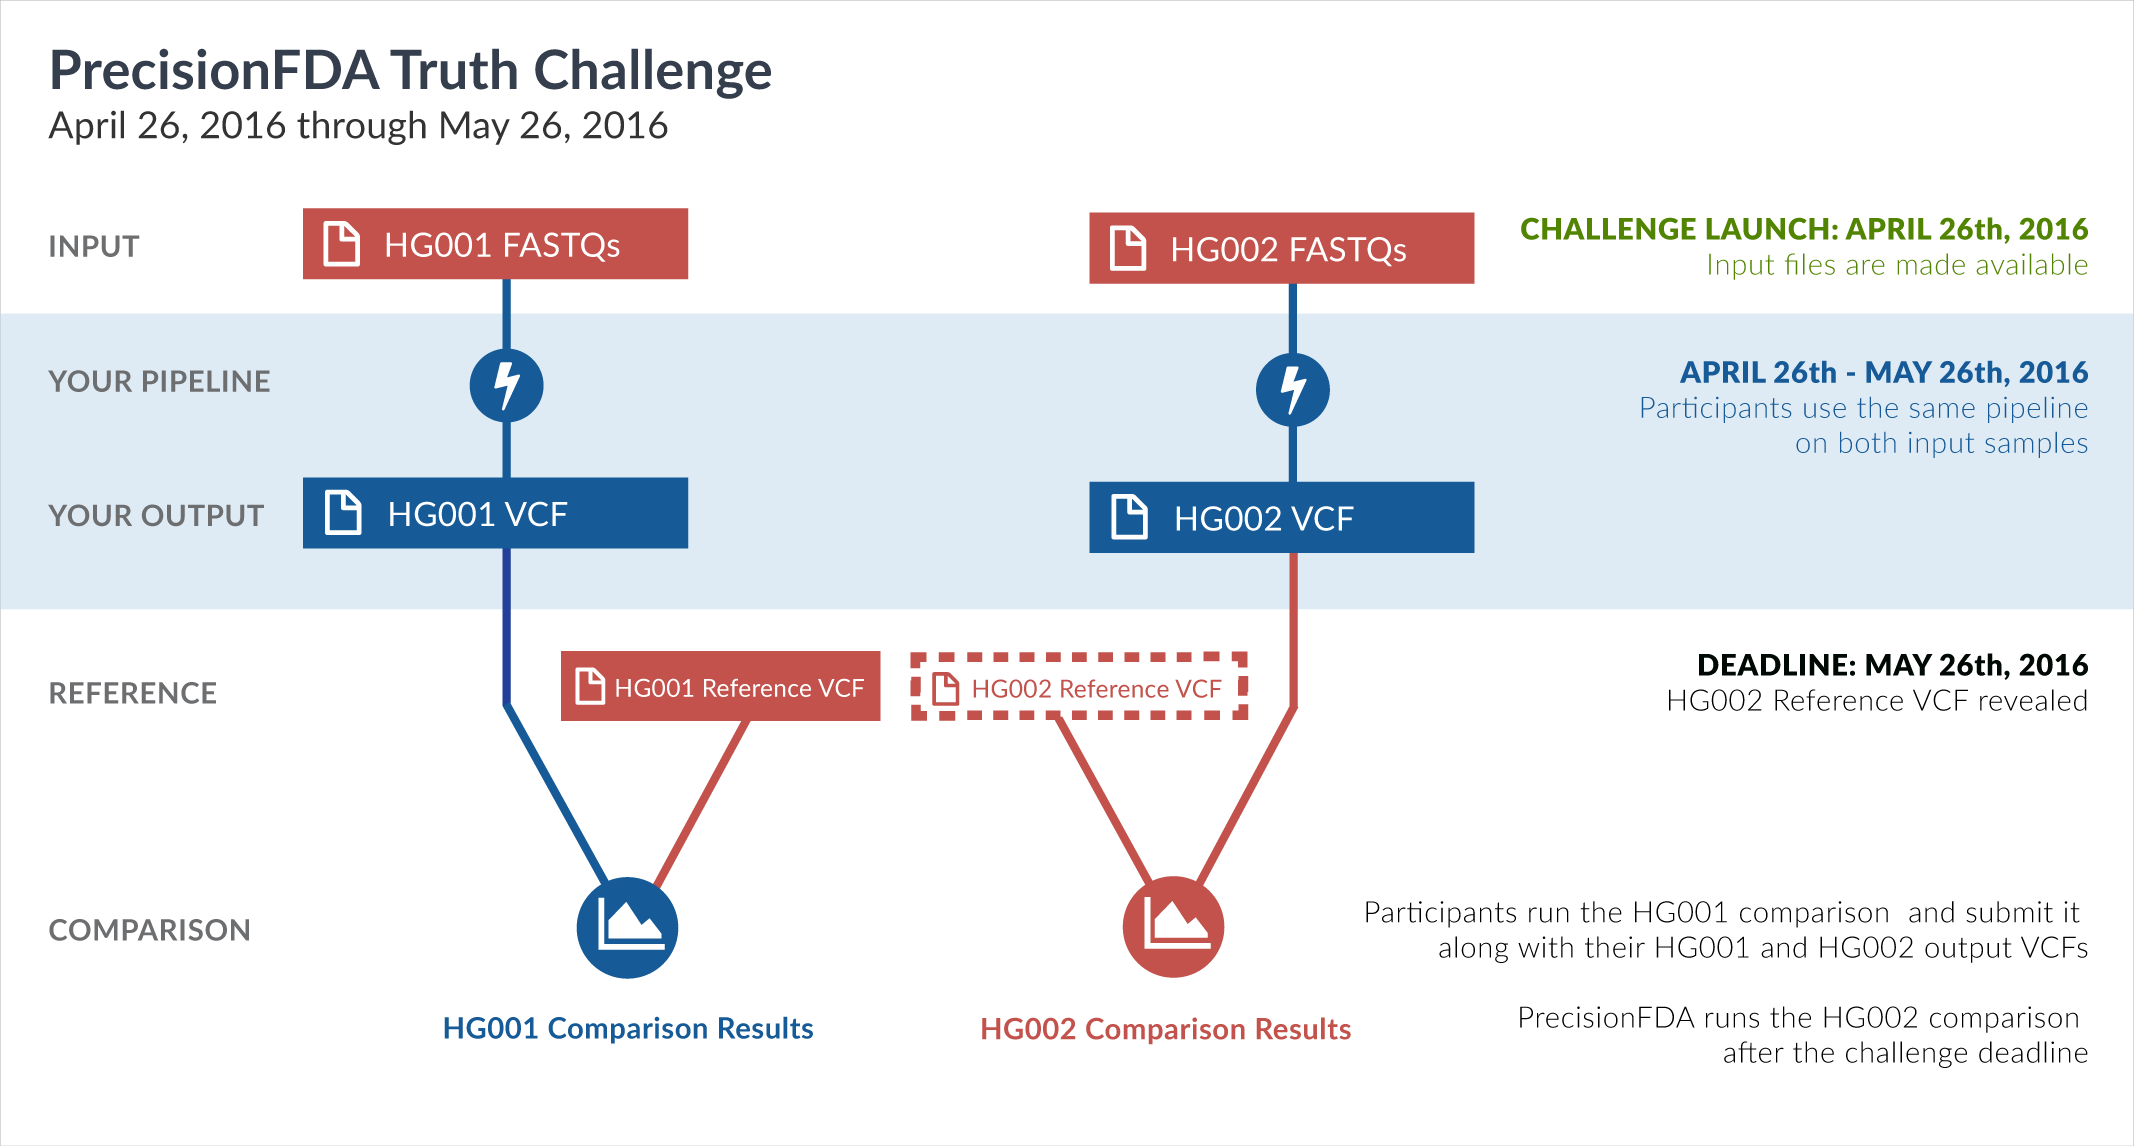
Truth Challenge
Engage and improve DNA test results with our community challenges
Explore HG002 comparison results
Use this interactive explorer to filter all results across submission entries and multiple dimensions.
| Entry | Type | Subtype | Subset | Genotype | F-score | Recall | Precision | Frac_NA | Truth TP | Truth FN | Query TP | Query FP | FP gt | % FP ma | |
|---|---|---|---|---|---|---|---|---|---|---|---|---|---|---|---|
|
55851-55900 / 86044 show all | |||||||||||||||
| asubramanian-gatk | INDEL | D6_15 | map_l100_m2_e0 | homalt | 94.3089 | 89.2308 | 100.0000 | 87.9418 | 58 | 7 | 58 | 0 | 0 | ||
| asubramanian-gatk | INDEL | I1_5 | map_l100_m2_e0 | * | 91.2346 | 85.1608 | 98.2412 | 87.9589 | 1165 | 203 | 1173 | 21 | 4 | 19.0476 | |
| asubramanian-gatk | INDEL | I1_5 | map_l100_m2_e0 | het | 87.2148 | 79.0668 | 97.2350 | 90.0428 | 627 | 166 | 633 | 18 | 2 | 11.1111 | |
| asubramanian-gatk | INDEL | I1_5 | map_l100_m2_e0 | hetalt | 96.5517 | 95.4545 | 97.6744 | 90.1376 | 42 | 2 | 42 | 1 | 0 | 0.0000 | |
| asubramanian-gatk | INDEL | I1_5 | map_l100_m2_e0 | homalt | 96.4050 | 93.4087 | 99.6000 | 83.0048 | 496 | 35 | 498 | 2 | 2 | 100.0000 | |
| asubramanian-gatk | INDEL | I6_15 | map_l100_m2_e0 | * | 93.2365 | 88.7931 | 98.1481 | 89.7045 | 103 | 13 | 106 | 2 | 1 | 50.0000 | |
| asubramanian-gatk | INDEL | I6_15 | map_l100_m2_e0 | het | 92.3641 | 88.5246 | 96.5517 | 90.5383 | 54 | 7 | 56 | 2 | 1 | 50.0000 | |
| asubramanian-gatk | INDEL | I6_15 | map_l100_m2_e0 | hetalt | 95.2381 | 90.9091 | 100.0000 | 82.0513 | 20 | 2 | 21 | 0 | 0 | ||
| asubramanian-gatk | INDEL | I6_15 | map_l100_m2_e0 | homalt | 93.5484 | 87.8788 | 100.0000 | 90.9091 | 29 | 4 | 29 | 0 | 0 | ||
| asubramanian-gatk | INDEL | I16_PLUS | map_l100_m2_e0 | * | 86.2745 | 84.6154 | 88.0000 | 96.2631 | 22 | 4 | 22 | 3 | 0 | 0.0000 | |
| asubramanian-gatk | INDEL | I16_PLUS | map_l100_m2_e0 | het | 85.7143 | 83.3333 | 88.2353 | 95.7393 | 15 | 3 | 15 | 2 | 0 | 0.0000 | |
| asubramanian-gatk | INDEL | I16_PLUS | map_l100_m2_e0 | hetalt | 80.0000 | 66.6667 | 100.0000 | 94.8718 | 2 | 1 | 2 | 0 | 0 | ||
| asubramanian-gatk | INDEL | I16_PLUS | map_l100_m2_e0 | homalt | 90.9091 | 100.0000 | 83.3333 | 97.4026 | 5 | 0 | 5 | 1 | 0 | 0.0000 | |
| asubramanian-gatk | INDEL | C6_15 | map_l100_m2_e0 | * | 0.0000 | 0.0000 | 92.0000 | 0 | 0 | 0 | 2 | 0 | 0.0000 | ||
| asubramanian-gatk | INDEL | C6_15 | map_l100_m2_e0 | het | 0.0000 | 0.0000 | 90.4762 | 0 | 0 | 0 | 2 | 0 | 0.0000 | ||
| asubramanian-gatk | INDEL | C6_15 | map_l100_m2_e0 | hetalt | 0.0000 | 0.0000 | 0.0000 | 0 | 0 | 0 | 0 | 0 | |||
| asubramanian-gatk | INDEL | C6_15 | map_l100_m2_e0 | homalt | 0.0000 | 100.0000 | 0 | 0 | 0 | 0 | 0 | ||||
| asubramanian-gatk | INDEL | D16_PLUS | map_l100_m2_e0 | * | 87.1508 | 86.6667 | 87.6404 | 95.9118 | 78 | 12 | 78 | 11 | 3 | 27.2727 | |
| asubramanian-gatk | INDEL | D16_PLUS | map_l100_m2_e0 | het | 84.4646 | 87.5000 | 81.6327 | 96.8161 | 42 | 6 | 40 | 9 | 2 | 22.2222 | |
| asubramanian-gatk | INDEL | D16_PLUS | map_l100_m2_e0 | hetalt | 87.6588 | 80.7692 | 95.8333 | 80.1653 | 21 | 5 | 23 | 1 | 1 | 100.0000 | |
| asubramanian-gatk | INDEL | D16_PLUS | map_l100_m2_e0 | homalt | 93.7500 | 93.7500 | 93.7500 | 96.9052 | 15 | 1 | 15 | 1 | 0 | 0.0000 | |
| asubramanian-gatk | INDEL | D1_5 | map_l100_m2_e0 | * | 93.0444 | 89.7128 | 96.6330 | 87.5446 | 1718 | 197 | 1722 | 60 | 7 | 11.6667 | |
| asubramanian-gatk | INDEL | C1_5 | map_l100_m2_e0 | * | 0.0000 | 0.0000 | 97.9592 | 0 | 0 | 0 | 1 | 0 | 0.0000 | ||
| asubramanian-gatk | INDEL | C1_5 | map_l100_m2_e0 | het | 0.0000 | 100.0000 | 0 | 0 | 0 | 0 | 0 | ||||
| asubramanian-gatk | INDEL | C1_5 | map_l100_m2_e0 | hetalt | 0.0000 | 0.0000 | 0.0000 | 0 | 0 | 0 | 0 | 0 | |||
| asubramanian-gatk | INDEL | C1_5 | map_l100_m2_e0 | homalt | 0.0000 | 0.0000 | 95.2381 | 0 | 0 | 0 | 1 | 0 | 0.0000 | ||
| astatham-gatk | SNP | ti | map_l100_m2_e0 | * | 92.0782 | 85.4292 | 99.8496 | 69.7884 | 41827 | 7134 | 41820 | 63 | 36 | 57.1429 | |
| astatham-gatk | SNP | ti | map_l100_m2_e0 | het | 86.9897 | 77.0982 | 99.7928 | 74.7072 | 23609 | 7013 | 23602 | 49 | 23 | 46.9388 | |
| astatham-gatk | SNP | ti | map_l100_m2_e0 | hetalt | 100.0000 | 100.0000 | 100.0000 | 69.6970 | 30 | 0 | 30 | 0 | 0 | ||
| astatham-gatk | SNP | ti | map_l100_m2_e0 | homalt | 99.6302 | 99.3391 | 99.9231 | 59.5727 | 18188 | 121 | 18188 | 14 | 13 | 92.8571 | |
| asubramanian-gatk | INDEL | * | map_l100_m2_e0 | * | 92.1174 | 87.8960 | 96.7646 | 96.1178 | 3246 | 447 | 3260 | 109 | 17 | 15.5963 | |
| asubramanian-gatk | INDEL | * | map_l100_m2_e0 | het | 89.6413 | 84.6987 | 95.1965 | 90.0770 | 1954 | 353 | 1962 | 99 | 13 | 13.1313 | |
| asubramanian-gatk | INDEL | * | map_l100_m2_e0 | hetalt | 94.6259 | 91.2000 | 98.3193 | 88.0762 | 114 | 11 | 117 | 2 | 1 | 50.0000 | |
| asubramanian-gatk | INDEL | * | map_l100_m2_e0 | homalt | 96.2820 | 93.4179 | 99.3272 | 85.6349 | 1178 | 83 | 1181 | 8 | 3 | 37.5000 | |
| asubramanian-gatk | INDEL | C16_PLUS | map_l100_m2_e0 | * | 0.0000 | 0.0000 | 97.6190 | 0 | 0 | 0 | 1 | 0 | 0.0000 | ||
| asubramanian-gatk | INDEL | C16_PLUS | map_l100_m2_e0 | het | 0.0000 | 0.0000 | 96.6667 | 0 | 0 | 0 | 1 | 0 | 0.0000 | ||
| asubramanian-gatk | INDEL | C16_PLUS | map_l100_m2_e0 | hetalt | 0.0000 | 100.0000 | 0 | 0 | 0 | 0 | 0 | ||||
| asubramanian-gatk | INDEL | C16_PLUS | map_l100_m2_e0 | homalt | 0.0000 | 100.0000 | 0 | 0 | 0 | 0 | 0 | ||||
| astatham-gatk | SNP | tv | map_l100_m2_e0 | * | 91.8266 | 85.0477 | 99.7797 | 71.9649 | 21290 | 3743 | 21286 | 47 | 16 | 34.0426 | |
| astatham-gatk | SNP | tv | map_l100_m2_e0 | het | 86.7029 | 76.7066 | 99.6951 | 76.6657 | 12102 | 3675 | 12098 | 37 | 10 | 27.0270 | |
| astatham-gatk | SNP | tv | map_l100_m2_e0 | hetalt | 98.7952 | 97.6190 | 100.0000 | 72.2973 | 41 | 1 | 41 | 0 | 0 | ||
| astatham-gatk | SNP | tv | map_l100_m2_e0 | homalt | 99.5809 | 99.2728 | 99.8908 | 61.7518 | 9147 | 67 | 9147 | 10 | 6 | 60.0000 | |
| astatham-gatk | INDEL | I1_5 | map_l100_m2_e0 | * | 96.5143 | 94.0789 | 99.0790 | 85.3464 | 1287 | 81 | 1291 | 12 | 4 | 33.3333 | |
| astatham-gatk | INDEL | I1_5 | map_l100_m2_e0 | het | 94.3221 | 90.0378 | 99.0345 | 86.8636 | 714 | 79 | 718 | 7 | 0 | 0.0000 | |
| astatham-gatk | INDEL | I1_5 | map_l100_m2_e0 | hetalt | 97.6744 | 95.4545 | 100.0000 | 89.4207 | 42 | 2 | 42 | 0 | 0 | ||
| astatham-gatk | INDEL | I1_5 | map_l100_m2_e0 | homalt | 99.5314 | 100.0000 | 99.0672 | 81.9892 | 531 | 0 | 531 | 5 | 4 | 80.0000 | |
| astatham-gatk | INDEL | I6_15 | map_l100_m2_e0 | * | 96.0352 | 93.9655 | 98.1982 | 88.6735 | 109 | 7 | 109 | 2 | 1 | 50.0000 | |
| astatham-gatk | INDEL | I6_15 | map_l100_m2_e0 | het | 95.0000 | 93.4426 | 96.6102 | 89.2139 | 57 | 4 | 57 | 2 | 1 | 50.0000 | |
| astatham-gatk | INDEL | I6_15 | map_l100_m2_e0 | hetalt | 95.2381 | 90.9091 | 100.0000 | 83.6066 | 20 | 2 | 20 | 0 | 0 | ||
| astatham-gatk | INDEL | I6_15 | map_l100_m2_e0 | homalt | 98.4615 | 96.9697 | 100.0000 | 89.7106 | 32 | 1 | 32 | 0 | 0 | ||