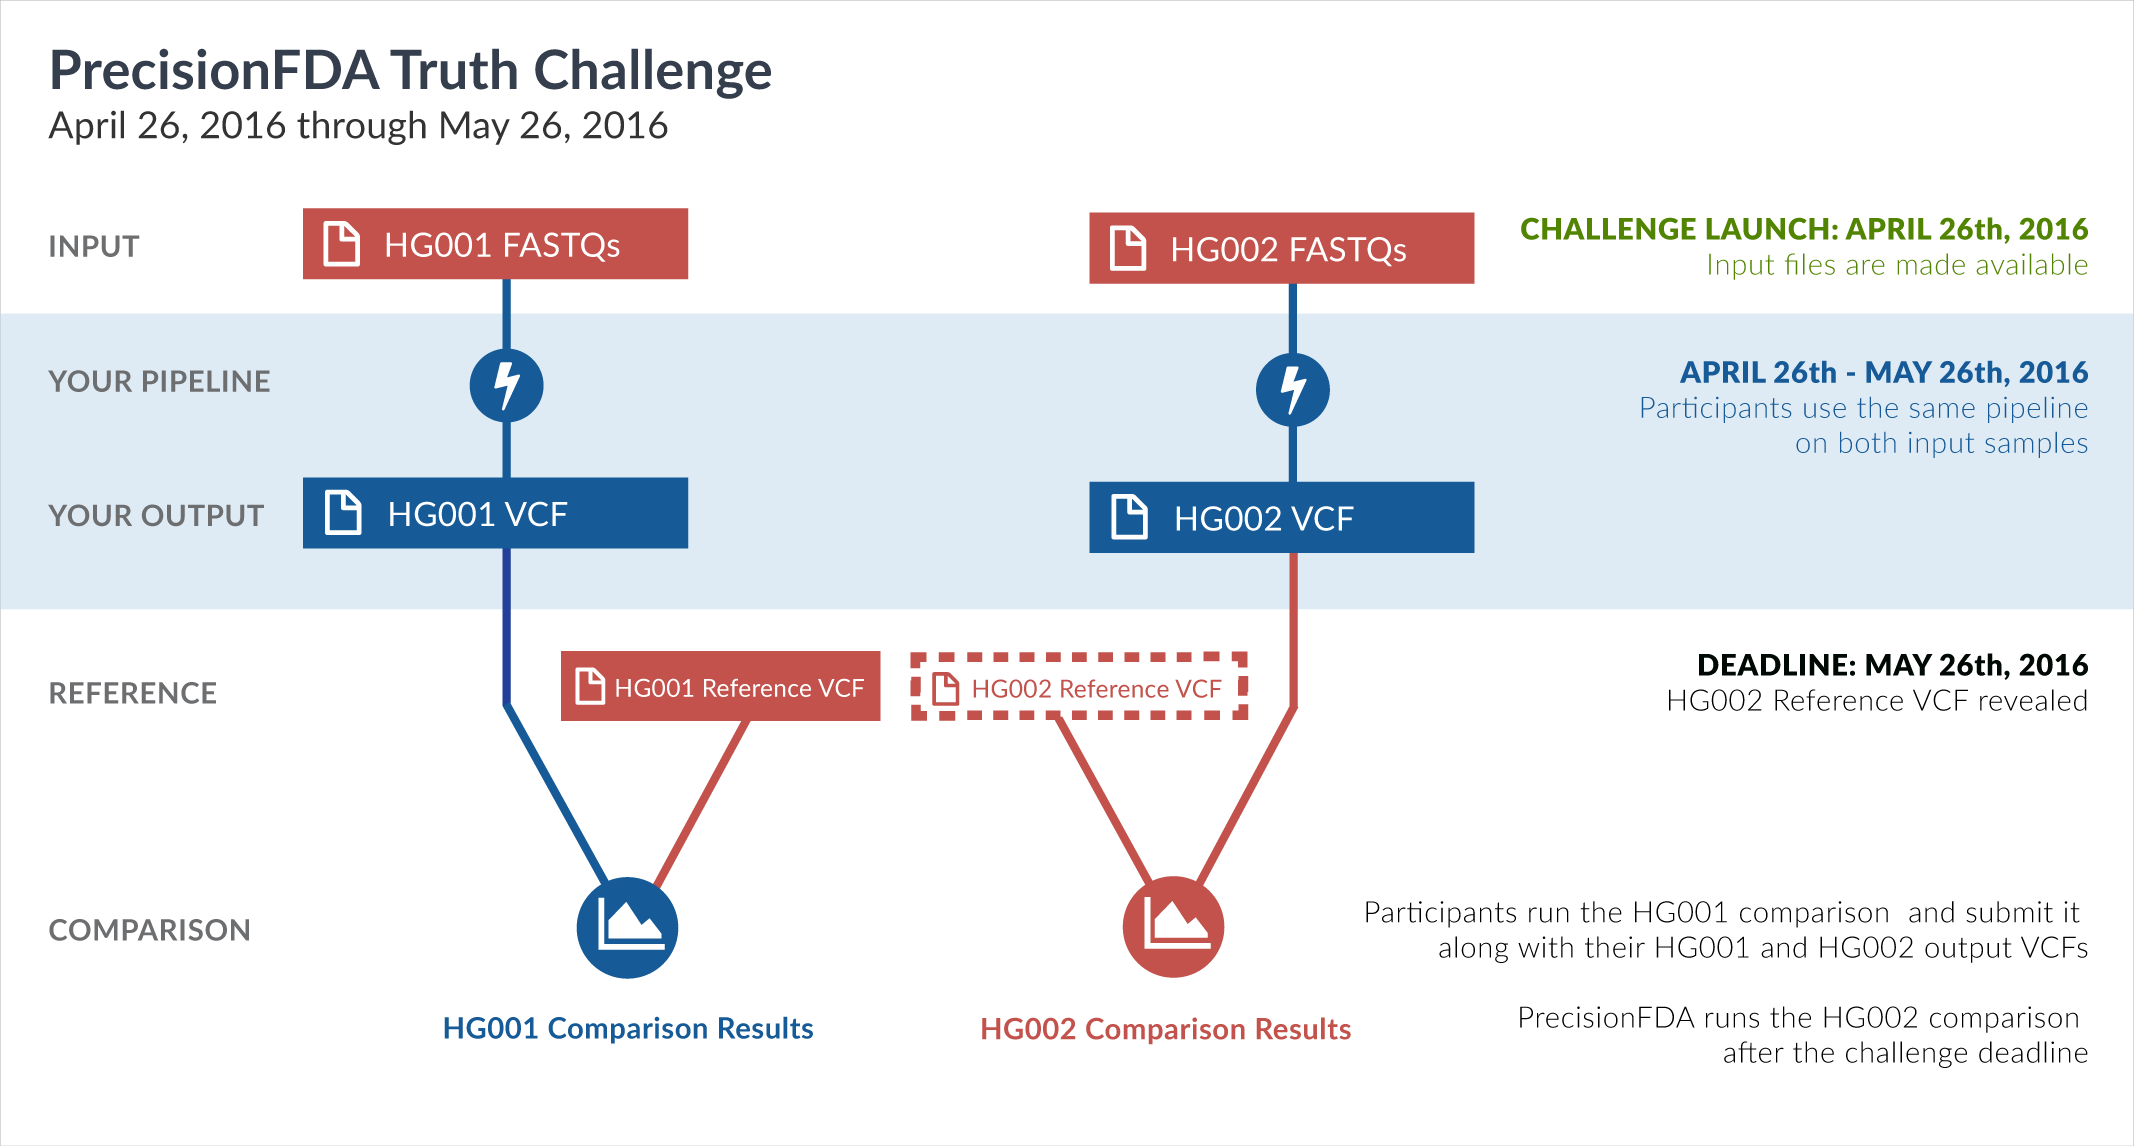
PrecisionFDA
Truth Challenge
Engage and improve DNA test results with our community challenges
Explore HG002 comparison results
Use this interactive explorer to filter all results across submission entries and multiple dimensions.
| Entry | Type | Subtype | Subset | Genotype | F-score | Recall | Precision | Frac_NA | Truth TP | Truth FN | Query TP | Query FP | FP gt | % FP ma | |
|---|---|---|---|---|---|---|---|---|---|---|---|---|---|---|---|
|
53551-53600 / 86044 show all | |||||||||||||||
| gduggal-bwafb | SNP | ti | map_l100_m1_e0 | homalt | 99.5923 | 99.2984 | 99.8880 | 61.5927 | 17834 | 126 | 17834 | 20 | 12 | 60.0000 | |
| asubramanian-gatk | SNP | * | map_l100_m1_e0 | * | 60.2018 | 43.0908 | 99.8527 | 84.6729 | 31199 | 41204 | 31193 | 46 | 12 | 26.0870 | |
| asubramanian-gatk | SNP | * | map_l100_m1_e0 | het | 63.0315 | 46.0636 | 99.7898 | 86.5707 | 20894 | 24465 | 20888 | 44 | 12 | 27.2727 | |
| asubramanian-gatk | SNP | * | map_l100_m1_e0 | hetalt | 48.1481 | 31.7073 | 100.0000 | 90.9091 | 13 | 28 | 13 | 0 | 0 | ||
| asubramanian-gatk | SNP | * | map_l100_m1_e0 | homalt | 55.1894 | 38.1143 | 99.9806 | 78.4662 | 10292 | 16711 | 10292 | 2 | 0 | 0.0000 | |
| asubramanian-gatk | INDEL | D6_15 | map_l100_m1_e0 | * | 93.4132 | 90.6977 | 96.2963 | 88.8224 | 234 | 24 | 234 | 9 | 3 | 33.3333 | |
| asubramanian-gatk | INDEL | D6_15 | map_l100_m1_e0 | het | 91.9355 | 90.4762 | 93.4426 | 91.7344 | 114 | 12 | 114 | 8 | 2 | 25.0000 | |
| asubramanian-gatk | INDEL | D6_15 | map_l100_m1_e0 | hetalt | 95.4545 | 92.6471 | 98.4375 | 73.3333 | 63 | 5 | 63 | 1 | 1 | 100.0000 | |
| asubramanian-gatk | INDEL | D6_15 | map_l100_m1_e0 | homalt | 94.2149 | 89.0625 | 100.0000 | 87.5546 | 57 | 7 | 57 | 0 | 0 | ||
| asubramanian-gatk | SNP | tv | map_l100_m1_e0 | * | 57.1254 | 40.0024 | 99.8777 | 86.7426 | 9801 | 14700 | 9799 | 12 | 2 | 16.6667 | |
| asubramanian-gatk | SNP | tv | map_l100_m1_e0 | het | 60.4053 | 43.3028 | 99.8355 | 88.3520 | 6676 | 8741 | 6674 | 11 | 2 | 18.1818 | |
| asubramanian-gatk | SNP | tv | map_l100_m1_e0 | hetalt | 48.1481 | 31.7073 | 100.0000 | 90.8451 | 13 | 28 | 13 | 0 | 0 | ||
| asubramanian-gatk | SNP | tv | map_l100_m1_e0 | homalt | 51.2011 | 34.4134 | 99.9679 | 81.0990 | 3112 | 5931 | 3112 | 1 | 0 | 0.0000 | |
| asubramanian-gatk | INDEL | I6_15 | map_l100_m1_e0 | * | 93.1123 | 88.5965 | 98.1132 | 89.0383 | 101 | 13 | 104 | 2 | 1 | 50.0000 | |
| asubramanian-gatk | INDEL | I6_15 | map_l100_m1_e0 | het | 92.0958 | 88.1356 | 96.4286 | 90.1060 | 52 | 7 | 54 | 2 | 1 | 50.0000 | |
| asubramanian-gatk | INDEL | I6_15 | map_l100_m1_e0 | hetalt | 95.2381 | 90.9091 | 100.0000 | 81.0811 | 20 | 2 | 21 | 0 | 0 | ||
| asubramanian-gatk | INDEL | I6_15 | map_l100_m1_e0 | homalt | 93.5484 | 87.8788 | 100.0000 | 90.0000 | 29 | 4 | 29 | 0 | 0 | ||
| asubramanian-gatk | INDEL | I16_PLUS | map_l100_m1_e0 | * | 88.0000 | 84.6154 | 91.6667 | 95.7895 | 22 | 4 | 22 | 2 | 0 | 0.0000 | |
| asubramanian-gatk | INDEL | I16_PLUS | map_l100_m1_e0 | het | 85.7143 | 83.3333 | 88.2353 | 95.0147 | 15 | 3 | 15 | 2 | 0 | 0.0000 | |
| asubramanian-gatk | INDEL | I16_PLUS | map_l100_m1_e0 | hetalt | 80.0000 | 66.6667 | 100.0000 | 93.7500 | 2 | 1 | 2 | 0 | 0 | ||
| asubramanian-gatk | INDEL | I16_PLUS | map_l100_m1_e0 | homalt | 100.0000 | 100.0000 | 100.0000 | 97.4619 | 5 | 0 | 5 | 0 | 0 | ||
| asubramanian-gatk | INDEL | I1_5 | map_l100_m1_e0 | * | 91.2060 | 85.1382 | 98.2051 | 87.1018 | 1140 | 199 | 1149 | 21 | 4 | 19.0476 | |
| asubramanian-gatk | INDEL | I1_5 | map_l100_m1_e0 | het | 87.1648 | 79.0219 | 97.1787 | 89.3631 | 614 | 163 | 620 | 18 | 2 | 11.1111 | |
| asubramanian-gatk | INDEL | I1_5 | map_l100_m1_e0 | hetalt | 96.5517 | 95.4545 | 97.6744 | 89.1688 | 42 | 2 | 42 | 1 | 0 | 0.0000 | |
| asubramanian-gatk | INDEL | I1_5 | map_l100_m1_e0 | homalt | 96.4155 | 93.4363 | 99.5910 | 81.7265 | 484 | 34 | 487 | 2 | 2 | 100.0000 | |
| asubramanian-gatk | SNP | ti | map_l100_m1_e0 | * | 61.7256 | 44.6642 | 99.8787 | 83.4799 | 21408 | 26523 | 21404 | 26 | 10 | 38.4615 | |
| asubramanian-gatk | SNP | ti | map_l100_m1_e0 | het | 64.3552 | 47.4851 | 99.8174 | 85.5215 | 14218 | 15724 | 14214 | 26 | 10 | 38.4615 | |
| asubramanian-gatk | SNP | ti | map_l100_m1_e0 | hetalt | 51.2821 | 34.4828 | 100.0000 | 89.3617 | 10 | 19 | 10 | 0 | 0 | ||
| asubramanian-gatk | SNP | ti | map_l100_m1_e0 | homalt | 57.1201 | 39.9777 | 100.0000 | 77.0416 | 7180 | 10780 | 7180 | 0 | 0 | ||
| asubramanian-gatk | INDEL | C1_5 | map_l100_m1_e0 | * | 0.0000 | 0.0000 | 97.9592 | 0 | 0 | 0 | 1 | 0 | 0.0000 | ||
| asubramanian-gatk | INDEL | C1_5 | map_l100_m1_e0 | het | 0.0000 | 100.0000 | 0 | 0 | 0 | 0 | 0 | ||||
| asubramanian-gatk | INDEL | C1_5 | map_l100_m1_e0 | hetalt | 0.0000 | 0.0000 | 0.0000 | 0 | 0 | 0 | 0 | 0 | |||
| asubramanian-gatk | INDEL | C1_5 | map_l100_m1_e0 | homalt | 0.0000 | 0.0000 | 95.2381 | 0 | 0 | 0 | 1 | 0 | 0.0000 | ||
| astatham-gatk | SNP | ti | map_l100_m1_e0 | * | 92.0088 | 85.3122 | 99.8461 | 68.2409 | 40891 | 7040 | 40884 | 63 | 36 | 57.1429 | |
| astatham-gatk | SNP | ti | map_l100_m1_e0 | het | 86.8541 | 76.8887 | 99.7875 | 73.5726 | 23022 | 6920 | 23015 | 49 | 23 | 46.9388 | |
| astatham-gatk | SNP | ti | map_l100_m1_e0 | hetalt | 100.0000 | 100.0000 | 100.0000 | 68.1319 | 29 | 0 | 29 | 0 | 0 | ||
| astatham-gatk | SNP | ti | map_l100_m1_e0 | homalt | 99.6258 | 99.3318 | 99.9216 | 57.0466 | 17840 | 120 | 17840 | 14 | 13 | 92.8571 | |
| asubramanian-gatk | INDEL | D16_PLUS | map_l100_m1_e0 | * | 87.2093 | 86.2069 | 88.2353 | 95.4955 | 75 | 12 | 75 | 10 | 3 | 30.0000 | |
| asubramanian-gatk | INDEL | D16_PLUS | map_l100_m1_e0 | het | 84.9211 | 86.9565 | 82.9787 | 96.4952 | 40 | 6 | 39 | 8 | 2 | 25.0000 | |
| asubramanian-gatk | INDEL | D16_PLUS | map_l100_m1_e0 | hetalt | 87.5829 | 80.7692 | 95.6522 | 79.6460 | 21 | 5 | 22 | 1 | 1 | 100.0000 | |
| asubramanian-gatk | INDEL | D16_PLUS | map_l100_m1_e0 | homalt | 93.3333 | 93.3333 | 93.3333 | 96.5358 | 14 | 1 | 14 | 1 | 0 | 0.0000 | |
| asubramanian-gatk | INDEL | D1_5 | map_l100_m1_e0 | * | 92.8980 | 89.5022 | 96.5618 | 87.1490 | 1654 | 194 | 1657 | 59 | 7 | 11.8644 | |
| asubramanian-gatk | INDEL | D1_5 | map_l100_m1_e0 | het | 90.9054 | 87.1795 | 94.9640 | 88.1323 | 1054 | 155 | 1056 | 56 | 6 | 10.7143 | |
| asubramanian-gatk | INDEL | D1_5 | map_l100_m1_e0 | hetalt | 96.7033 | 93.6170 | 100.0000 | 91.0020 | 44 | 3 | 44 | 0 | 0 | ||
| asubramanian-gatk | INDEL | D1_5 | map_l100_m1_e0 | homalt | 96.6121 | 93.9189 | 99.4643 | 83.9725 | 556 | 36 | 557 | 3 | 1 | 33.3333 | |
| asubramanian-gatk | INDEL | C16_PLUS | map_l100_m1_e0 | * | 0.0000 | 0.0000 | 96.9697 | 0 | 0 | 0 | 1 | 0 | 0.0000 | ||
| asubramanian-gatk | INDEL | C16_PLUS | map_l100_m1_e0 | het | 0.0000 | 0.0000 | 95.4545 | 0 | 0 | 0 | 1 | 0 | 0.0000 | ||
| asubramanian-gatk | INDEL | C16_PLUS | map_l100_m1_e0 | hetalt | 0.0000 | 100.0000 | 0 | 0 | 0 | 0 | 0 | ||||
| asubramanian-gatk | INDEL | C16_PLUS | map_l100_m1_e0 | homalt | 0.0000 | 100.0000 | 0 | 0 | 0 | 0 | 0 | ||||
| astatham-gatk | SNP | tv | map_l100_m1_e0 | * | 91.7374 | 84.8986 | 99.7745 | 70.4613 | 20801 | 3700 | 20797 | 47 | 16 | 34.0426 | |