PrecisionFDA
Truth Challenge
Engage and improve DNA test results with our community challenges
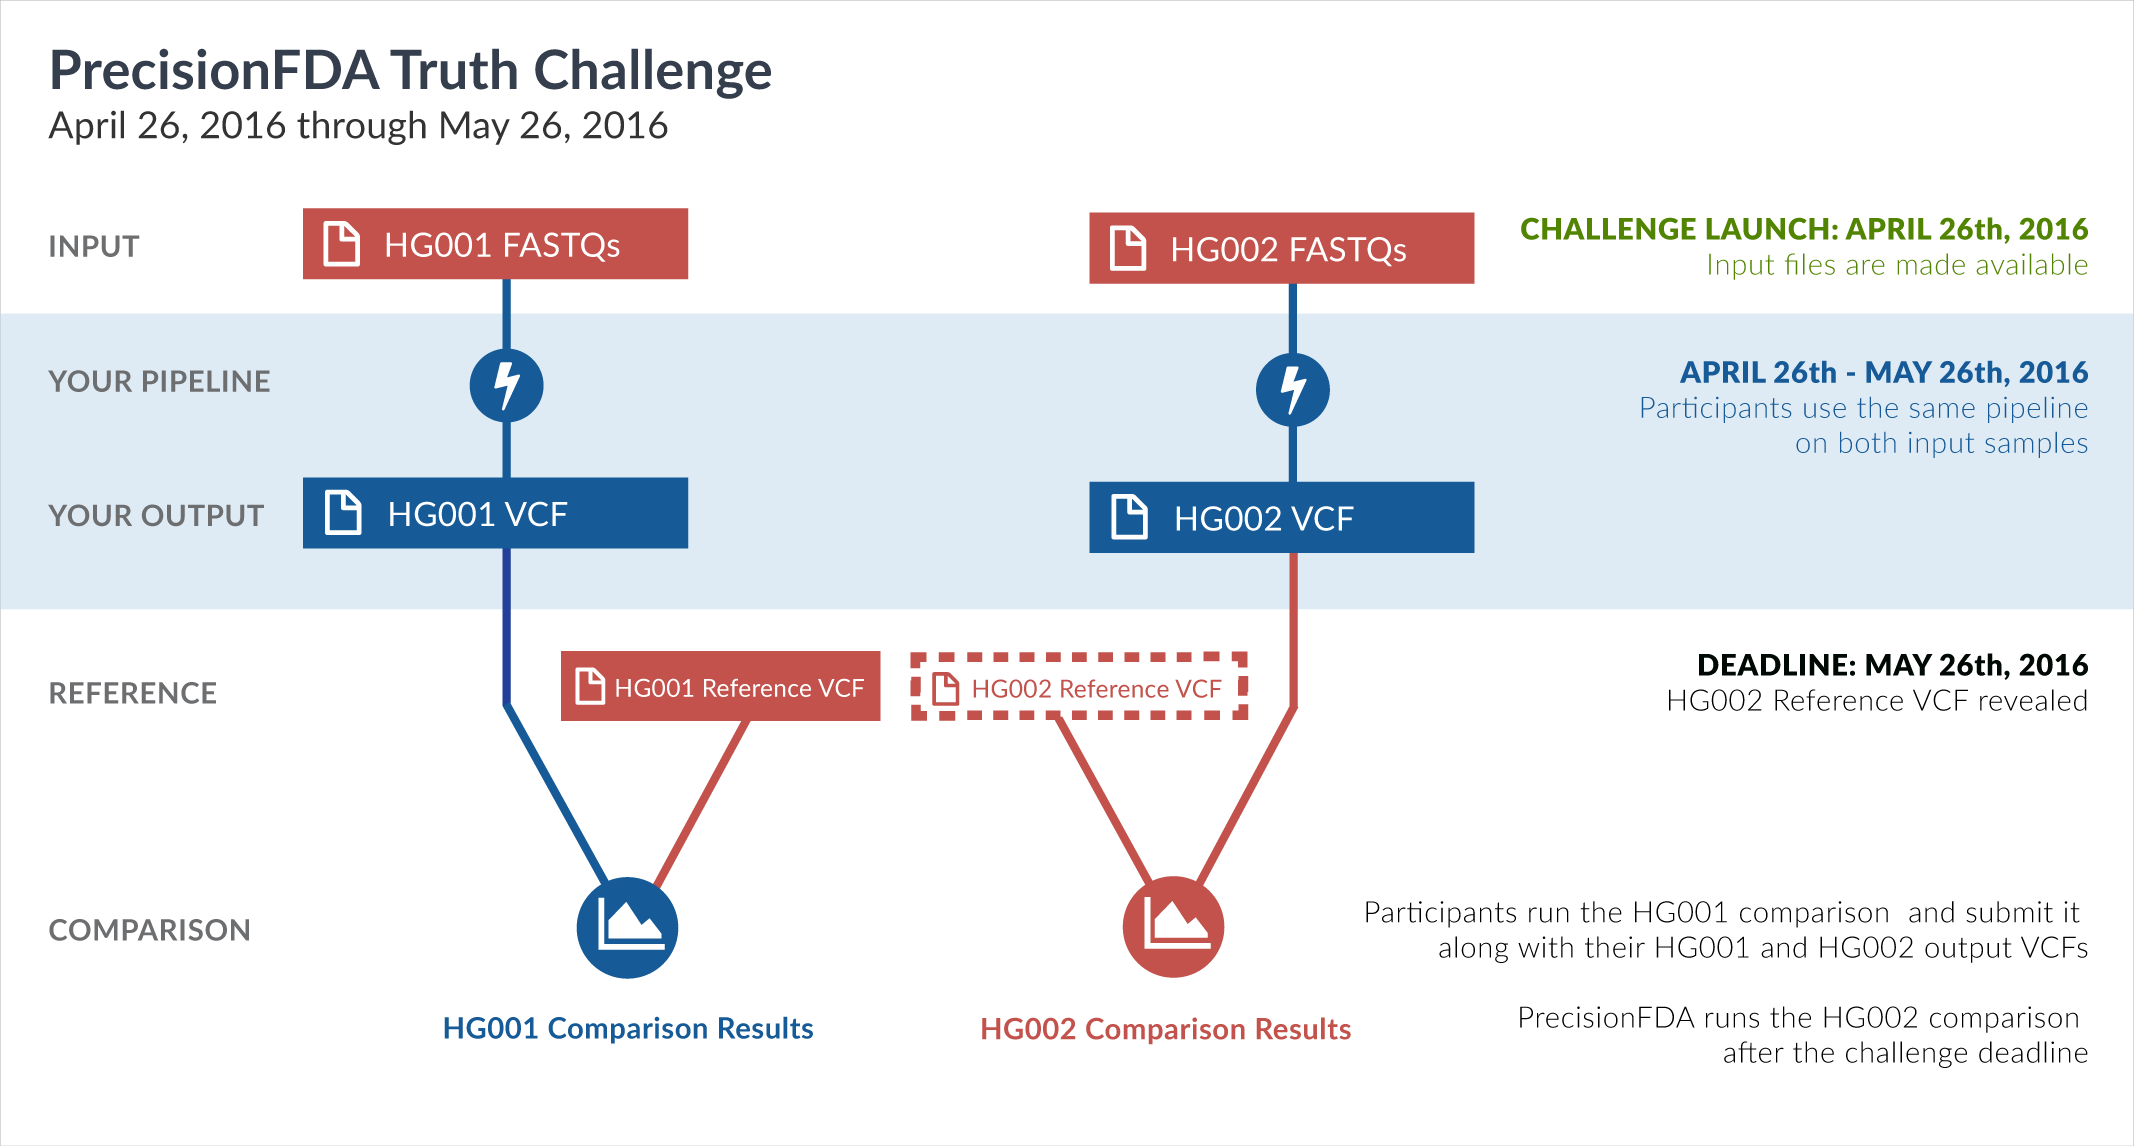
Explore HG002 comparison results
Use this interactive explorer to filter all results across submission entries and multiple dimensions.
| Entry | Type | Subtype | Subset | Genotype | F-score | Recall | Precision | Frac_NA | Truth TP | Truth FN | Query TP | Query FP | FP gt | % FP ma | |
|---|---|---|---|---|---|---|---|---|---|---|---|---|---|---|---|
|
37351-37400 / 86044 show all | |||||||||||||||
| astatham-gatk | INDEL | I16_PLUS | lowcmp_SimpleRepeat_homopolymer_6to10 | homalt | 88.8889 | 100.0000 | 80.0000 | 91.5254 | 4 | 0 | 4 | 1 | 1 | 100.0000 | |
| astatham-gatk | INDEL | I16_PLUS | map_l100_m0_e0 | het | 87.5000 | 87.5000 | 87.5000 | 95.7219 | 7 | 1 | 7 | 1 | 0 | 0.0000 | |
| astatham-gatk | INDEL | I16_PLUS | map_l100_m0_e0 | homalt | 80.0000 | 100.0000 | 66.6667 | 98.2558 | 2 | 0 | 2 | 1 | 0 | 0.0000 | |
| astatham-gatk | INDEL | I16_PLUS | map_l100_m1_e0 | het | 91.4286 | 88.8889 | 94.1176 | 94.5860 | 16 | 2 | 16 | 1 | 0 | 0.0000 | |
| astatham-gatk | INDEL | I16_PLUS | map_l100_m1_e0 | homalt | 90.9091 | 100.0000 | 83.3333 | 97.6000 | 5 | 0 | 5 | 1 | 0 | 0.0000 | |
| astatham-gatk | INDEL | I16_PLUS | map_l125_m0_e0 | het | 85.7143 | 100.0000 | 75.0000 | 97.3333 | 3 | 0 | 3 | 1 | 0 | 0.0000 | |
| astatham-gatk | INDEL | I16_PLUS | map_l125_m0_e0 | homalt | 80.0000 | 100.0000 | 66.6667 | 98.0132 | 2 | 0 | 2 | 1 | 0 | 0.0000 | |
| astatham-gatk | INDEL | I16_PLUS | map_l125_m1_e0 | het | 88.8889 | 88.8889 | 88.8889 | 96.0699 | 8 | 1 | 8 | 1 | 0 | 0.0000 | |
| astatham-gatk | INDEL | I16_PLUS | map_l125_m1_e0 | homalt | 85.7143 | 100.0000 | 75.0000 | 98.0676 | 3 | 0 | 3 | 1 | 0 | 0.0000 | |
| astatham-gatk | INDEL | I16_PLUS | map_l125_m2_e0 | het | 88.8889 | 88.8889 | 88.8889 | 96.6543 | 8 | 1 | 8 | 1 | 0 | 0.0000 | |
| astatham-gatk | INDEL | I16_PLUS | map_l125_m2_e1 | het | 88.8889 | 88.8889 | 88.8889 | 96.6667 | 8 | 1 | 8 | 1 | 0 | 0.0000 | |
| astatham-gatk | INDEL | I16_PLUS | map_l150_m0_e0 | het | 80.0000 | 100.0000 | 66.6667 | 97.7273 | 2 | 0 | 2 | 1 | 0 | 0.0000 | |
| astatham-gatk | INDEL | I16_PLUS | map_l150_m0_e0 | homalt | 66.6667 | 100.0000 | 50.0000 | 98.4962 | 1 | 0 | 1 | 1 | 0 | 0.0000 | |
| astatham-gatk | INDEL | I16_PLUS | map_l150_m1_e0 | het | 83.3333 | 83.3333 | 83.3333 | 96.8085 | 5 | 1 | 5 | 1 | 0 | 0.0000 | |
| astatham-gatk | INDEL | I16_PLUS | map_l150_m1_e0 | homalt | 85.7143 | 100.0000 | 75.0000 | 97.7528 | 3 | 0 | 3 | 1 | 0 | 0.0000 | |
| astatham-gatk | INDEL | I16_PLUS | map_l150_m2_e0 | het | 83.3333 | 83.3333 | 83.3333 | 97.1831 | 5 | 1 | 5 | 1 | 0 | 0.0000 | |
| astatham-gatk | INDEL | I16_PLUS | map_l150_m2_e0 | homalt | 85.7143 | 100.0000 | 75.0000 | 97.8836 | 3 | 0 | 3 | 1 | 0 | 0.0000 | |
| astatham-gatk | INDEL | I16_PLUS | map_l150_m2_e1 | het | 83.3333 | 83.3333 | 83.3333 | 97.1963 | 5 | 1 | 5 | 1 | 0 | 0.0000 | |
| astatham-gatk | INDEL | I16_PLUS | map_l150_m2_e1 | homalt | 85.7143 | 100.0000 | 75.0000 | 97.8947 | 3 | 0 | 3 | 1 | 0 | 0.0000 | |
| astatham-gatk | INDEL | I16_PLUS | map_l250_m0_e0 | het | 0.0000 | 0.0000 | 98.6486 | 0 | 0 | 0 | 1 | 0 | 0.0000 | ||
| astatham-gatk | INDEL | I16_PLUS | map_l250_m0_e0 | homalt | 0.0000 | 0.0000 | 98.8889 | 0 | 0 | 0 | 1 | 0 | 0.0000 | ||
| astatham-gatk | INDEL | I16_PLUS | map_l250_m1_e0 | het | 66.6667 | 100.0000 | 50.0000 | 98.4375 | 1 | 0 | 1 | 1 | 0 | 0.0000 | |
| astatham-gatk | INDEL | I16_PLUS | map_l250_m1_e0 | homalt | 0.0000 | 0.0000 | 99.2424 | 0 | 0 | 0 | 1 | 0 | 0.0000 | ||
| astatham-gatk | INDEL | I16_PLUS | map_l250_m2_e0 | het | 66.6667 | 100.0000 | 50.0000 | 98.5401 | 1 | 0 | 1 | 1 | 0 | 0.0000 | |
| astatham-gatk | INDEL | I16_PLUS | map_l250_m2_e0 | homalt | 0.0000 | 0.0000 | 99.2857 | 0 | 0 | 0 | 1 | 0 | 0.0000 | ||
| astatham-gatk | INDEL | I16_PLUS | map_l250_m2_e1 | het | 66.6667 | 100.0000 | 50.0000 | 98.5714 | 1 | 0 | 1 | 1 | 0 | 0.0000 | |
| astatham-gatk | INDEL | I16_PLUS | map_l250_m2_e1 | homalt | 0.0000 | 0.0000 | 99.3056 | 0 | 0 | 0 | 1 | 0 | 0.0000 | ||
| astatham-gatk | INDEL | I16_PLUS | map_siren | homalt | 95.2381 | 95.2381 | 95.2381 | 95.4447 | 20 | 1 | 20 | 1 | 1 | 100.0000 | |
| astatham-gatk | INDEL | I16_PLUS | segdup | * | 98.9474 | 100.0000 | 97.9167 | 95.9459 | 47 | 0 | 47 | 1 | 0 | 0.0000 | |
| astatham-gatk | INDEL | I16_PLUS | segdup | homalt | 97.4359 | 100.0000 | 95.0000 | 94.6809 | 19 | 0 | 19 | 1 | 0 | 0.0000 | |
| astatham-gatk | INDEL | I1_5 | lowcmp_AllRepeats_51to200bp_gt95identity_merged | hetalt | 92.3933 | 85.9532 | 99.8765 | 41.6427 | 771 | 126 | 809 | 1 | 1 | 100.0000 | |
| astatham-gatk | INDEL | I1_5 | lowcmp_Human_Full_Genome_TRDB_hg19_150331_TRgt6_lt51bp_gt95identity_merged | het | 99.8179 | 99.8179 | 99.8179 | 80.9639 | 548 | 1 | 548 | 1 | 0 | 0.0000 | |
| astatham-gatk | INDEL | I1_5 | lowcmp_Human_Full_Genome_TRDB_hg19_150331_TRgt6_lt51bp_gt95identity_merged | homalt | 99.8557 | 100.0000 | 99.7118 | 79.1717 | 346 | 0 | 346 | 1 | 1 | 100.0000 | |
| astatham-gatk | INDEL | I1_5 | lowcmp_SimpleRepeat_diTR_11to50 | hetalt | 97.6470 | 95.4271 | 99.9726 | 29.9483 | 3631 | 174 | 3655 | 1 | 1 | 100.0000 | |
| astatham-gatk | INDEL | I1_5 | lowcmp_SimpleRepeat_diTR_51to200 | het | 82.8729 | 92.5926 | 75.0000 | 96.7742 | 25 | 2 | 3 | 1 | 0 | 0.0000 | |
| astatham-gatk | INDEL | I1_5 | lowcmp_SimpleRepeat_diTR_51to200 | hetalt | 75.4780 | 60.8939 | 99.2481 | 29.2553 | 109 | 70 | 132 | 1 | 1 | 100.0000 | |
| astatham-gatk | INDEL | I1_5 | lowcmp_SimpleRepeat_homopolymer_6to10 | hetalt | 98.3979 | 97.1519 | 99.6764 | 72.8471 | 307 | 9 | 308 | 1 | 1 | 100.0000 | |
| astatham-gatk | INDEL | I1_5 | lowcmp_SimpleRepeat_quadTR_51to200 | het | 93.5774 | 90.1961 | 97.2222 | 94.2308 | 46 | 5 | 35 | 1 | 0 | 0.0000 | |
| astatham-gatk | INDEL | I1_5 | lowcmp_SimpleRepeat_quadTR_51to200 | homalt | 66.6667 | 100.0000 | 50.0000 | 98.3471 | 1 | 0 | 1 | 1 | 1 | 100.0000 | |
| astatham-gatk | INDEL | I1_5 | lowcmp_SimpleRepeat_triTR_11to50 | het | 99.5738 | 99.3617 | 99.7868 | 68.6707 | 467 | 3 | 468 | 1 | 1 | 100.0000 | |
| astatham-gatk | INDEL | I1_5 | lowcmp_SimpleRepeat_triTR_51to200 | * | 96.0000 | 96.0000 | 96.0000 | 61.5385 | 24 | 1 | 24 | 1 | 0 | 0.0000 | |
| astatham-gatk | INDEL | I1_5 | lowcmp_SimpleRepeat_triTR_51to200 | het | 80.0000 | 100.0000 | 66.6667 | 91.6667 | 2 | 0 | 2 | 1 | 0 | 0.0000 | |
| astatham-gatk | INDEL | I1_5 | map_l150_m0_e0 | het | 95.6145 | 92.4528 | 99.0000 | 93.7422 | 98 | 8 | 99 | 1 | 0 | 0.0000 | |
| astatham-gatk | INDEL | I1_5 | map_l250_m0_e0 | * | 93.6170 | 91.6667 | 95.6522 | 98.1673 | 22 | 2 | 22 | 1 | 1 | 100.0000 | |
| astatham-gatk | INDEL | I1_5 | map_l250_m0_e0 | homalt | 94.7368 | 100.0000 | 90.0000 | 96.7742 | 9 | 0 | 9 | 1 | 1 | 100.0000 | |
| astatham-gatk | INDEL | I6_15 | func_cds | * | 97.6744 | 97.6744 | 97.6744 | 38.5714 | 42 | 1 | 42 | 1 | 1 | 100.0000 | |
| astatham-gatk | INDEL | I6_15 | func_cds | homalt | 96.7742 | 100.0000 | 93.7500 | 40.7407 | 15 | 0 | 15 | 1 | 1 | 100.0000 | |
| astatham-gatk | INDEL | I6_15 | lowcmp_AllRepeats_51to200bp_gt95identity_merged | hetalt | 93.9097 | 88.6792 | 99.7959 | 48.3122 | 470 | 60 | 489 | 1 | 1 | 100.0000 | |
| astatham-gatk | INDEL | I6_15 | lowcmp_Human_Full_Genome_TRDB_hg19_150331_TRgt6_lt101bp_gt95identity_merged | * | 99.4338 | 99.1525 | 99.7167 | 70.1606 | 351 | 3 | 352 | 1 | 1 | 100.0000 | |
| astatham-gatk | INDEL | I6_15 | lowcmp_Human_Full_Genome_TRDB_hg19_150331_TRgt6_lt101bp_gt95identity_merged | homalt | 99.4595 | 100.0000 | 98.9247 | 69.9029 | 92 | 0 | 92 | 1 | 1 | 100.0000 | |