PrecisionFDA
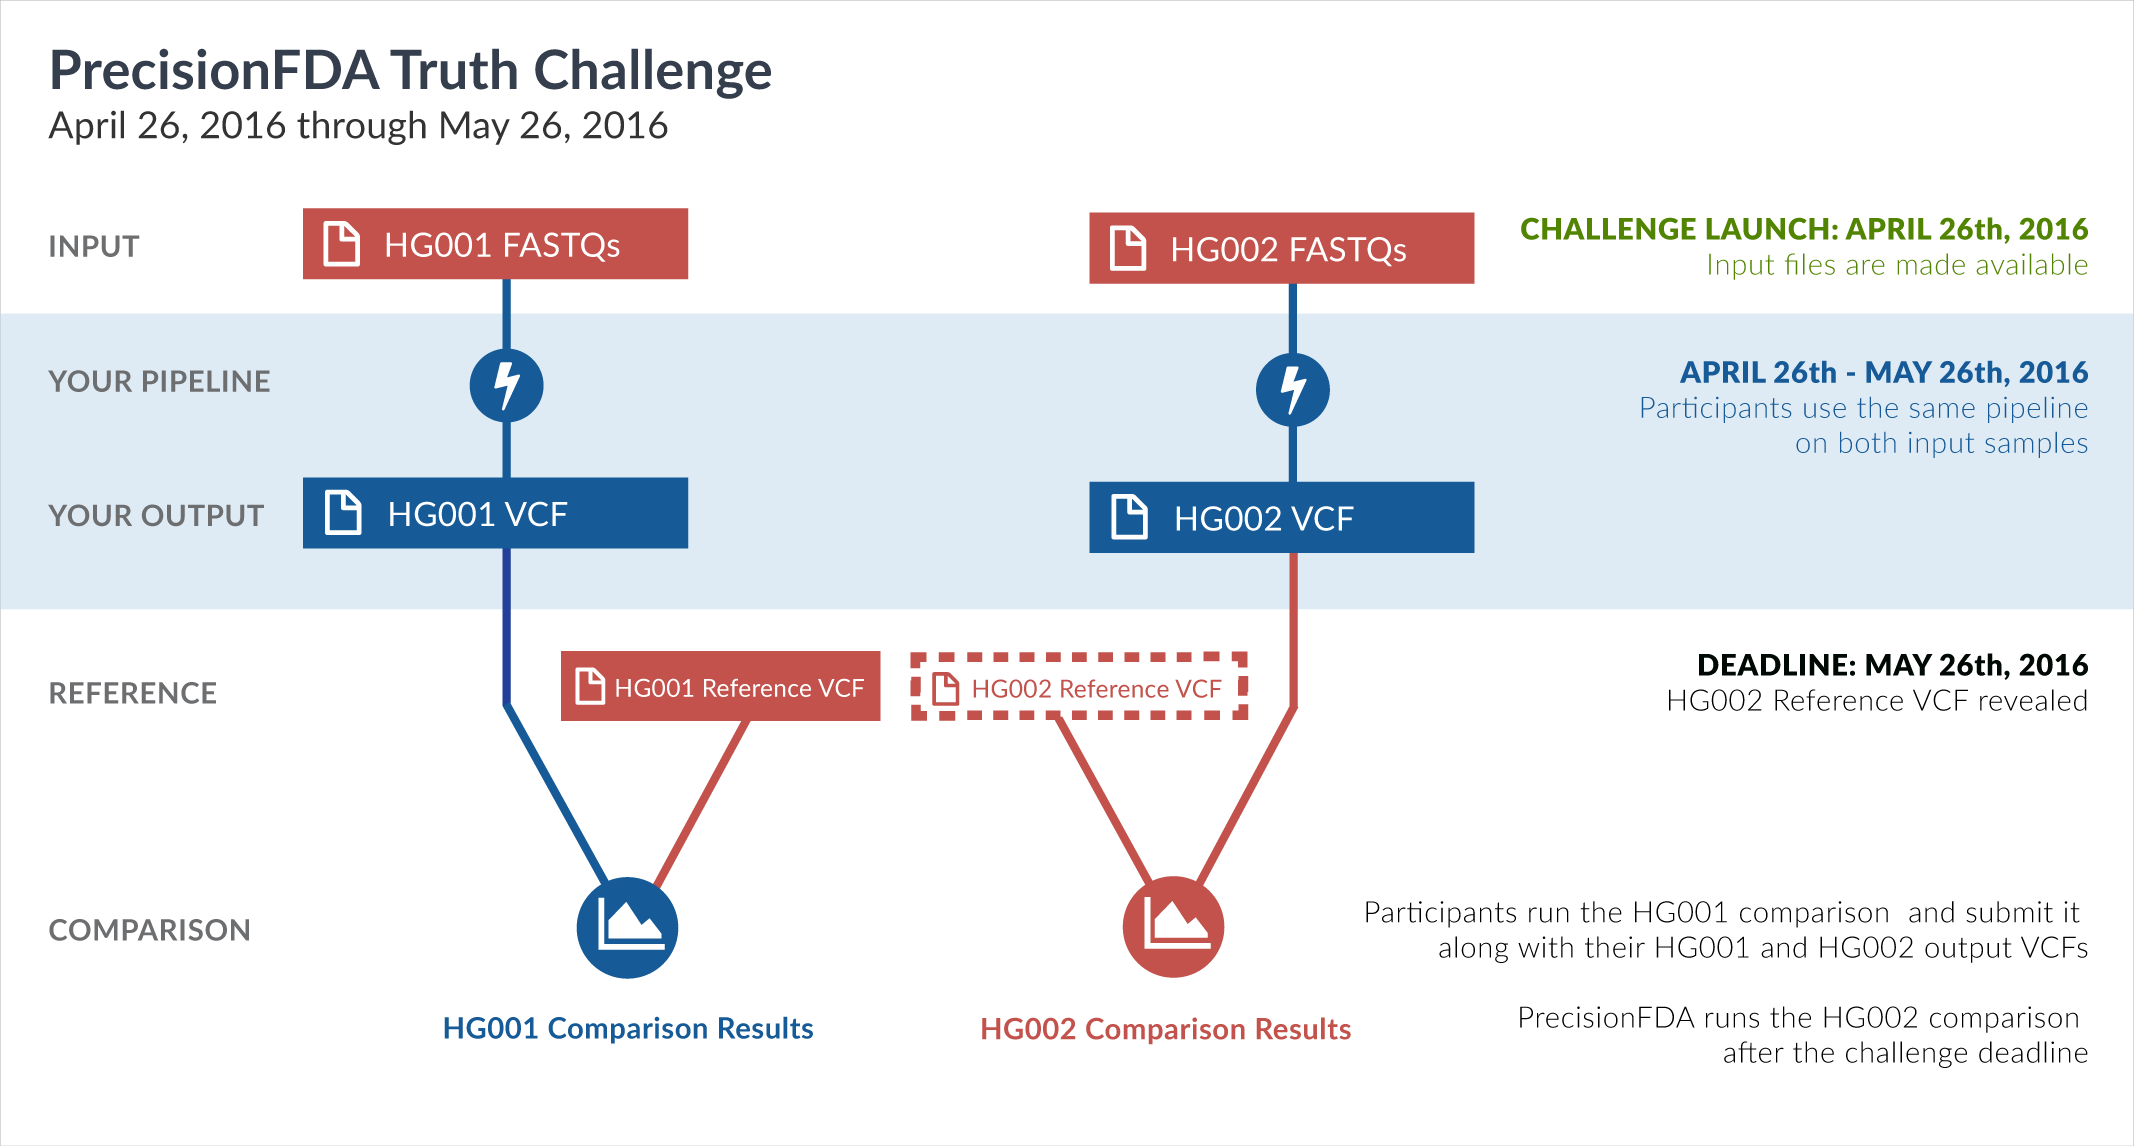
Truth Challenge
Engage and improve DNA test results with our community challenges
Explore HG002 comparison results
Use this interactive explorer to filter all results across submission entries and multiple dimensions.
| Entry | Type | Subtype | Subset | Genotype | F-score | Recall | Precision | Frac_NA | Truth TP | Truth FN | Query TP | Query FP | FP gt | % FP ma | |
|---|---|---|---|---|---|---|---|---|---|---|---|---|---|---|---|
|
36851-36900 / 86044 show all | |||||||||||||||
| astatham-gatk | INDEL | I16_PLUS | lowcmp_SimpleRepeat_quadTR_11to50 | * | 99.2248 | 98.9691 | 99.4819 | 76.0248 | 384 | 4 | 384 | 2 | 1 | 50.0000 | |
| astatham-gatk | INDEL | I16_PLUS | lowcmp_SimpleRepeat_quadTR_11to50 | het | 98.8024 | 98.8095 | 98.7952 | 79.1980 | 166 | 2 | 164 | 2 | 1 | 50.0000 | |
| astatham-gatk | INDEL | I16_PLUS | map_l100_m0_e0 | * | 86.9565 | 90.9091 | 83.3333 | 96.7480 | 10 | 1 | 10 | 2 | 0 | 0.0000 | |
| astatham-gatk | INDEL | I16_PLUS | map_l100_m1_e0 | * | 90.1961 | 88.4615 | 92.0000 | 95.7627 | 23 | 3 | 23 | 2 | 0 | 0.0000 | |
| astatham-gatk | INDEL | I16_PLUS | map_l100_m2_e0 | het | 88.8889 | 88.8889 | 88.8889 | 95.1482 | 16 | 2 | 16 | 2 | 1 | 50.0000 | |
| astatham-gatk | INDEL | I16_PLUS | map_l100_m2_e0 | homalt | 83.3333 | 100.0000 | 71.4286 | 97.5177 | 5 | 0 | 5 | 2 | 0 | 0.0000 | |
| astatham-gatk | INDEL | I16_PLUS | map_l100_m2_e1 | het | 88.8889 | 88.8889 | 88.8889 | 95.1613 | 16 | 2 | 16 | 2 | 1 | 50.0000 | |
| astatham-gatk | INDEL | I16_PLUS | map_l100_m2_e1 | homalt | 83.3333 | 100.0000 | 71.4286 | 97.5265 | 5 | 0 | 5 | 2 | 0 | 0.0000 | |
| astatham-gatk | INDEL | I16_PLUS | map_l125_m0_e0 | * | 85.7143 | 100.0000 | 75.0000 | 97.4026 | 6 | 0 | 6 | 2 | 0 | 0.0000 | |
| astatham-gatk | INDEL | I16_PLUS | map_l125_m1_e0 | * | 86.6667 | 86.6667 | 86.6667 | 96.6960 | 13 | 2 | 13 | 2 | 0 | 0.0000 | |
| astatham-gatk | INDEL | I16_PLUS | map_l125_m2_e0 | homalt | 75.0000 | 100.0000 | 60.0000 | 97.7578 | 3 | 0 | 3 | 2 | 0 | 0.0000 | |
| astatham-gatk | INDEL | I16_PLUS | map_l125_m2_e1 | homalt | 75.0000 | 100.0000 | 60.0000 | 97.7578 | 3 | 0 | 3 | 2 | 0 | 0.0000 | |
| astatham-gatk | INDEL | I16_PLUS | map_l150_m0_e0 | * | 80.0000 | 100.0000 | 66.6667 | 97.7778 | 4 | 0 | 4 | 2 | 0 | 0.0000 | |
| astatham-gatk | INDEL | I16_PLUS | map_l150_m1_e0 | * | 81.8182 | 81.8182 | 81.8182 | 97.0899 | 9 | 2 | 9 | 2 | 0 | 0.0000 | |
| astatham-gatk | INDEL | I16_PLUS | map_l150_m2_e0 | * | 81.8182 | 81.8182 | 81.8182 | 97.3494 | 9 | 2 | 9 | 2 | 0 | 0.0000 | |
| astatham-gatk | INDEL | I16_PLUS | map_l150_m2_e1 | * | 81.8182 | 81.8182 | 81.8182 | 97.3621 | 9 | 2 | 9 | 2 | 0 | 0.0000 | |
| astatham-gatk | INDEL | I16_PLUS | map_l250_m0_e0 | * | 0.0000 | 0.0000 | 98.7879 | 0 | 0 | 0 | 2 | 0 | 0.0000 | ||
| astatham-gatk | INDEL | I16_PLUS | map_l250_m1_e0 | * | 50.0000 | 100.0000 | 33.3333 | 98.8550 | 1 | 0 | 1 | 2 | 0 | 0.0000 | |
| astatham-gatk | INDEL | I16_PLUS | map_l250_m2_e0 | * | 50.0000 | 100.0000 | 33.3333 | 98.9247 | 1 | 0 | 1 | 2 | 0 | 0.0000 | |
| astatham-gatk | INDEL | I16_PLUS | map_l250_m2_e1 | * | 50.0000 | 100.0000 | 33.3333 | 98.9510 | 1 | 0 | 1 | 2 | 0 | 0.0000 | |
| astatham-gatk | INDEL | I1_5 | func_cds | * | 99.4505 | 100.0000 | 98.9071 | 34.4086 | 180 | 0 | 181 | 2 | 0 | 0.0000 | |
| astatham-gatk | INDEL | I1_5 | func_cds | het | 98.3607 | 100.0000 | 96.7742 | 40.9524 | 59 | 0 | 60 | 2 | 0 | 0.0000 | |
| astatham-gatk | INDEL | I1_5 | lowcmp_Human_Full_Genome_TRDB_hg19_150331 | hetalt | 97.2655 | 94.7083 | 99.9646 | 39.5202 | 5584 | 312 | 5645 | 2 | 2 | 100.0000 | |
| astatham-gatk | INDEL | I1_5 | lowcmp_Human_Full_Genome_TRDB_hg19_150331_TRgt6_51to200bp_gt95identity_merged | het | 98.0966 | 96.8208 | 99.4065 | 69.4192 | 335 | 11 | 335 | 2 | 0 | 0.0000 | |
| astatham-gatk | INDEL | I1_5 | lowcmp_Human_Full_Genome_TRDB_hg19_150331_TRgt6_lt101bp_gt95identity_merged | het | 99.6764 | 99.6119 | 99.7409 | 78.4116 | 770 | 3 | 770 | 2 | 0 | 0.0000 | |
| astatham-gatk | INDEL | I1_5 | lowcmp_Human_Full_Genome_TRDB_hg19_150331_TRgt6_lt101bp_gt95identity_merged | homalt | 99.7912 | 100.0000 | 99.5833 | 75.9398 | 478 | 0 | 478 | 2 | 2 | 100.0000 | |
| astatham-gatk | INDEL | I1_5 | lowcmp_Human_Full_Genome_TRDB_hg19_150331_TRgt6_lt51bp_gt95identity_merged | * | 99.7906 | 99.7906 | 99.7906 | 80.3781 | 953 | 2 | 953 | 2 | 1 | 50.0000 | |
| astatham-gatk | INDEL | I1_5 | lowcmp_Human_Full_Genome_TRDB_hg19_150331_TRlt7_lt101bp_gt95identity_merged | hetalt | 96.8954 | 94.0176 | 99.9548 | 27.2727 | 4369 | 278 | 4422 | 2 | 2 | 100.0000 | |
| astatham-gatk | INDEL | I1_5 | lowcmp_Human_Full_Genome_TRDB_hg19_150331_TRlt7_lt51bp_gt95identity_merged | hetalt | 97.4954 | 95.1601 | 99.9482 | 25.7593 | 3834 | 195 | 3860 | 2 | 2 | 100.0000 | |
| astatham-gatk | INDEL | I1_5 | lowcmp_Human_Full_Genome_TRDB_hg19_150331_all_gt95identity_merged | hetalt | 96.8567 | 93.9438 | 99.9559 | 31.0125 | 4483 | 289 | 4536 | 2 | 2 | 100.0000 | |
| astatham-gatk | INDEL | I1_5 | lowcmp_Human_Full_Genome_TRDB_hg19_150331_all_merged | hetalt | 97.2655 | 94.7083 | 99.9646 | 39.5202 | 5584 | 312 | 5645 | 2 | 2 | 100.0000 | |
| astatham-gatk | INDEL | I1_5 | lowcmp_SimpleRepeat_diTR_51to200 | * | 78.3660 | 65.0485 | 98.5401 | 58.3587 | 134 | 72 | 135 | 2 | 1 | 50.0000 | |
| astatham-gatk | INDEL | I1_5 | lowcmp_SimpleRepeat_homopolymer_6to10 | het | 99.6719 | 99.4905 | 99.8539 | 72.1465 | 1367 | 7 | 1367 | 2 | 0 | 0.0000 | |
| astatham-gatk | INDEL | I1_5 | lowcmp_SimpleRepeat_homopolymer_6to10 | homalt | 99.8968 | 100.0000 | 99.7938 | 64.2066 | 968 | 0 | 968 | 2 | 2 | 100.0000 | |
| astatham-gatk | INDEL | I1_5 | lowcmp_SimpleRepeat_quadTR_51to200 | * | 96.5649 | 94.0520 | 99.2157 | 76.9231 | 253 | 16 | 253 | 2 | 1 | 50.0000 | |
| astatham-gatk | INDEL | I1_5 | lowcmp_SimpleRepeat_triTR_11to50 | homalt | 99.6269 | 100.0000 | 99.2565 | 66.2907 | 267 | 0 | 267 | 2 | 2 | 100.0000 | |
| astatham-gatk | INDEL | I1_5 | map_l150_m0_e0 | homalt | 98.5294 | 100.0000 | 97.1014 | 88.8530 | 67 | 0 | 67 | 2 | 2 | 100.0000 | |
| astatham-gatk | INDEL | I1_5 | map_l250_m1_e0 | het | 94.0171 | 91.6667 | 96.4912 | 96.8733 | 55 | 5 | 55 | 2 | 0 | 0.0000 | |
| astatham-gatk | INDEL | I1_5 | map_l250_m1_e0 | homalt | 97.7778 | 100.0000 | 95.6522 | 94.0415 | 44 | 0 | 44 | 2 | 2 | 100.0000 | |
| astatham-gatk | INDEL | I1_5 | map_l250_m2_e0 | het | 93.7500 | 90.9091 | 96.7742 | 97.0878 | 60 | 6 | 60 | 2 | 0 | 0.0000 | |
| astatham-gatk | INDEL | I1_5 | map_l250_m2_e0 | homalt | 97.8261 | 100.0000 | 95.7447 | 94.8408 | 45 | 0 | 45 | 2 | 2 | 100.0000 | |
| astatham-gatk | INDEL | I1_5 | map_l250_m2_e1 | het | 93.7500 | 90.9091 | 96.7742 | 97.1946 | 60 | 6 | 60 | 2 | 0 | 0.0000 | |
| astatham-gatk | INDEL | I1_5 | map_l250_m2_e1 | homalt | 97.8723 | 100.0000 | 95.8333 | 94.8718 | 46 | 0 | 46 | 2 | 2 | 100.0000 | |
| astatham-gatk | INDEL | I1_5 | segdup | homalt | 99.5772 | 99.5772 | 99.5772 | 92.7984 | 471 | 2 | 471 | 2 | 2 | 100.0000 | |
| astatham-gatk | INDEL | I6_15 | HG002compoundhet | hetalt | 96.4594 | 93.1826 | 99.9750 | 29.7620 | 7955 | 582 | 7996 | 2 | 2 | 100.0000 | |
| astatham-gatk | INDEL | I6_15 | lowcmp_SimpleRepeat_diTR_51to200 | * | 83.2298 | 72.8261 | 97.1014 | 59.1716 | 67 | 25 | 67 | 2 | 1 | 50.0000 | |
| astatham-gatk | INDEL | I6_15 | map_l100_m1_e0 | * | 95.9641 | 93.8596 | 98.1651 | 87.8348 | 107 | 7 | 107 | 2 | 1 | 50.0000 | |
| astatham-gatk | INDEL | I6_15 | map_l100_m1_e0 | het | 94.8276 | 93.2203 | 96.4912 | 88.7352 | 55 | 4 | 55 | 2 | 1 | 50.0000 | |
| astatham-gatk | INDEL | I6_15 | map_l100_m2_e0 | * | 96.0352 | 93.9655 | 98.1982 | 88.6735 | 109 | 7 | 109 | 2 | 1 | 50.0000 | |
| astatham-gatk | INDEL | I6_15 | map_l100_m2_e0 | het | 95.0000 | 93.4426 | 96.6102 | 89.2139 | 57 | 4 | 57 | 2 | 1 | 50.0000 | |