PrecisionFDA
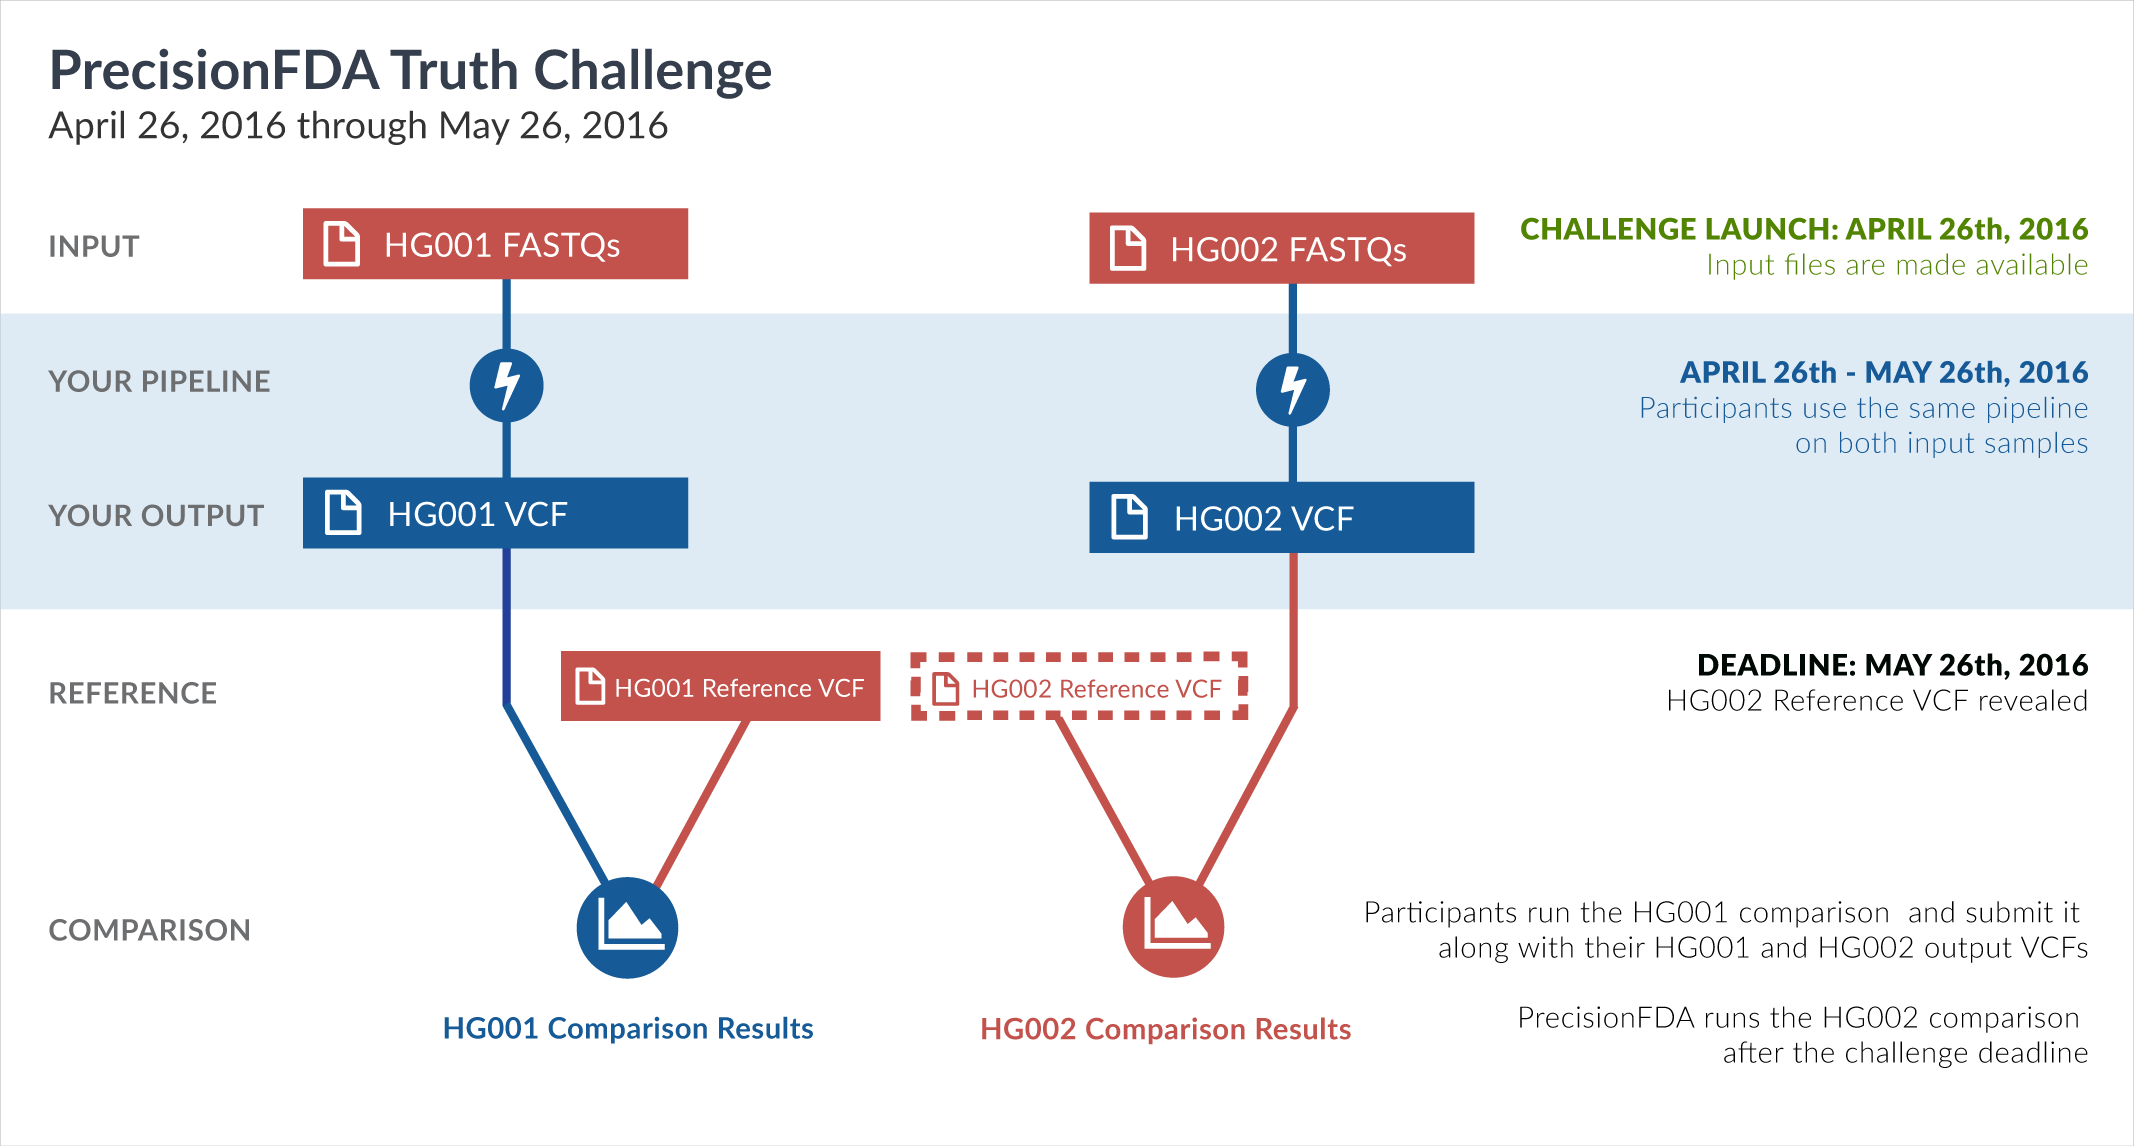
Truth Challenge
Engage and improve DNA test results with our community challenges
Explore HG002 comparison results
Use this interactive explorer to filter all results across submission entries and multiple dimensions.
| Entry | Type | Subtype | Subset | Genotype | F-score | Recall | Precision | Frac_NA | Truth TP | Truth FN | Query TP | Query FP | FP gt | % FP ma | |
|---|---|---|---|---|---|---|---|---|---|---|---|---|---|---|---|
|
26501-26550 / 86044 show all | |||||||||||||||
| asubramanian-gatk | INDEL | I1_5 | map_l250_m1_e0 | het | 82.4561 | 78.3333 | 87.0370 | 97.7070 | 47 | 13 | 47 | 7 | 0 | 0.0000 | |
| asubramanian-gatk | INDEL | I1_5 | map_l250_m2_e0 | * | 87.8505 | 83.1858 | 93.0693 | 97.3379 | 94 | 19 | 94 | 7 | 0 | 0.0000 | |
| asubramanian-gatk | INDEL | I1_5 | map_l250_m2_e0 | het | 82.2581 | 77.2727 | 87.9310 | 97.8716 | 51 | 15 | 51 | 7 | 0 | 0.0000 | |
| asubramanian-gatk | INDEL | I1_5 | map_l250_m2_e1 | * | 87.9630 | 83.3333 | 93.1373 | 97.3953 | 95 | 19 | 95 | 7 | 0 | 0.0000 | |
| asubramanian-gatk | INDEL | I1_5 | map_l250_m2_e1 | het | 82.2581 | 77.2727 | 87.9310 | 97.9454 | 51 | 15 | 51 | 7 | 0 | 0.0000 | |
| asubramanian-gatk | INDEL | I1_5 | segdup | * | 98.7667 | 98.2059 | 99.3340 | 95.0336 | 1040 | 19 | 1044 | 7 | 2 | 28.5714 | |
| asubramanian-gatk | SNP | * | lowcmp_SimpleRepeat_diTR_51to200 | hetalt | 0.0000 | 0.0000 | 75.0000 | 0 | 0 | 0 | 7 | 0 | 0.0000 | ||
| asubramanian-gatk | SNP | * | map_l250_m2_e0 | * | 31.9242 | 19.0108 | 99.5352 | 98.3542 | 1499 | 6386 | 1499 | 7 | 1 | 14.2857 | |
| asubramanian-gatk | SNP | * | map_l250_m2_e0 | het | 33.8604 | 20.4082 | 99.3440 | 98.5469 | 1060 | 4134 | 1060 | 7 | 1 | 14.2857 | |
| asubramanian-gatk | SNP | * | map_l250_m2_e1 | * | 32.0765 | 19.1186 | 99.5437 | 98.3572 | 1527 | 6460 | 1527 | 7 | 1 | 14.2857 | |
| asubramanian-gatk | SNP | * | map_l250_m2_e1 | het | 34.0104 | 20.5167 | 99.3560 | 98.5506 | 1080 | 4184 | 1080 | 7 | 1 | 14.2857 | |
| anovak-vg | INDEL | I1_5 | lowcmp_SimpleRepeat_triTR_51to200 | het | 0.0000 | 0.0000 | 41.6667 | 69.2308 | 0 | 2 | 5 | 7 | 7 | 100.0000 | |
| anovak-vg | INDEL | I1_5 | map_l250_m0_e0 | homalt | 66.9856 | 77.7778 | 58.8235 | 97.3725 | 7 | 2 | 10 | 7 | 7 | 100.0000 | |
| anovak-vg | SNP | ti | map_l250_m1_e0 | homalt | 84.7951 | 73.9266 | 99.4103 | 87.1481 | 1188 | 419 | 1180 | 7 | 5 | 71.4286 | |
| anovak-vg | SNP | ti | map_l250_m2_e0 | homalt | 85.1522 | 74.4425 | 99.4611 | 88.0122 | 1302 | 447 | 1292 | 7 | 5 | 71.4286 | |
| anovak-vg | SNP | ti | map_l250_m2_e1 | homalt | 85.1502 | 74.4357 | 99.4681 | 88.0298 | 1319 | 453 | 1309 | 7 | 5 | 71.4286 | |
| astatham-gatk | INDEL | * | lowcmp_Human_Full_Genome_TRDB_hg19_150331_TRgt6_lt101bp_gt95identity_merged | homalt | 99.7617 | 99.8940 | 99.6298 | 72.6774 | 1884 | 2 | 1884 | 7 | 5 | 71.4286 | |
| astatham-gatk | INDEL | * | lowcmp_SimpleRepeat_homopolymer_gt10 | * | 94.7563 | 95.1613 | 94.3548 | 99.9176 | 118 | 6 | 117 | 7 | 0 | 0.0000 | |
| astatham-gatk | INDEL | * | lowcmp_SimpleRepeat_homopolymer_gt10 | het | 92.5252 | 93.1034 | 91.9540 | 99.8905 | 81 | 6 | 80 | 7 | 0 | 0.0000 | |
| astatham-gatk | INDEL | * | lowcmp_SimpleRepeat_triTR_51to200 | * | 96.1232 | 95.4955 | 96.7593 | 64.9351 | 212 | 10 | 209 | 7 | 4 | 57.1429 | |
| astatham-gatk | INDEL | * | map_l125_m2_e0 | homalt | 99.2806 | 99.4758 | 99.0862 | 86.9395 | 759 | 4 | 759 | 7 | 4 | 57.1429 | |
| astatham-gatk | INDEL | * | map_l125_m2_e1 | homalt | 99.2908 | 99.4832 | 99.0991 | 87.0284 | 770 | 4 | 770 | 7 | 4 | 57.1429 | |
| astatham-gatk | SNP | * | lowcmp_Human_Full_Genome_TRDB_hg19_150331_TRlt7_lt51bp_gt95identity_merged | het | 97.6447 | 95.8388 | 99.5199 | 88.8259 | 1451 | 63 | 1451 | 7 | 7 | 100.0000 | |
| astatham-gatk | SNP | ti | HG002compoundhet | homalt | 99.8918 | 99.8783 | 99.9053 | 30.4740 | 7385 | 9 | 7385 | 7 | 7 | 100.0000 | |
| astatham-gatk | SNP | ti | lowcmp_AllRepeats_51to200bp_gt95identity_merged | het | 98.7032 | 97.7767 | 99.6475 | 68.5461 | 1979 | 45 | 1979 | 7 | 5 | 71.4286 | |
| astatham-gatk | SNP | ti | lowcmp_Human_Full_Genome_TRDB_hg19_150331_all_gt95identity_merged | het | 99.0127 | 98.2067 | 99.8321 | 79.0112 | 4162 | 76 | 4162 | 7 | 4 | 57.1429 | |
| astatham-gatk | SNP | tv | lowcmp_Human_Full_Genome_TRDB_hg19_150331_TRlt7_lt101bp_gt95identity_merged | het | 97.5501 | 95.9474 | 99.2072 | 89.6154 | 876 | 37 | 876 | 7 | 6 | 85.7143 | |
| astatham-gatk | SNP | tv | map_l100_m0_e0 | homalt | 99.2548 | 98.6999 | 99.8159 | 61.6440 | 3796 | 50 | 3796 | 7 | 4 | 57.1429 | |
| astatham-gatk | SNP | tv | map_l150_m1_e0 | homalt | 99.2995 | 98.7836 | 99.8207 | 68.8894 | 3898 | 48 | 3898 | 7 | 5 | 71.4286 | |
| astatham-gatk | SNP | tv | map_l150_m2_e0 | homalt | 99.3231 | 98.8244 | 99.8268 | 71.2518 | 4035 | 48 | 4035 | 7 | 5 | 71.4286 | |
| astatham-gatk | SNP | tv | map_l150_m2_e1 | homalt | 99.3315 | 98.8389 | 99.8290 | 71.2267 | 4086 | 48 | 4086 | 7 | 5 | 71.4286 | |
| asubramanian-gatk | INDEL | * | lowcmp_SimpleRepeat_triTR_51to200 | homalt | 93.3333 | 100.0000 | 87.5000 | 56.9231 | 47 | 0 | 49 | 7 | 2 | 28.5714 | |
| asubramanian-gatk | INDEL | * | map_l100_m1_e0 | homalt | 96.2599 | 93.3170 | 99.3945 | 84.7554 | 1145 | 82 | 1149 | 7 | 3 | 42.8571 | |
| asubramanian-gatk | INDEL | C16_PLUS | lowcmp_Human_Full_Genome_TRDB_hg19_150331_TRgt6_51to200bp_gt95identity_merged | * | 0.0000 | 0.0000 | 90.7895 | 0 | 0 | 0 | 7 | 0 | 0.0000 | ||
| asubramanian-gatk | INDEL | C1_5 | lowcmp_Human_Full_Genome_TRDB_hg19_150331_TRgt6_51to200bp_gt95identity_merged | * | 0.0000 | 0.0000 | 88.8889 | 0 | 0 | 0 | 7 | 0 | 0.0000 | ||
| asubramanian-gatk | INDEL | C1_5 | lowcmp_SimpleRepeat_diTR_51to200 | homalt | 0.0000 | 0.0000 | 36.3636 | 0 | 0 | 0 | 7 | 0 | 0.0000 | ||
| asubramanian-gatk | INDEL | D16_PLUS | lowcmp_Human_Full_Genome_TRDB_hg19_150331_TRgt6_lt101bp_gt95identity_merged | * | 98.5348 | 97.9369 | 99.1400 | 71.5584 | 807 | 17 | 807 | 7 | 3 | 42.8571 | |
| asubramanian-gatk | INDEL | D16_PLUS | lowcmp_SimpleRepeat_diTR_11to50 | homalt | 98.5000 | 98.7469 | 98.2544 | 65.8723 | 394 | 5 | 394 | 7 | 5 | 71.4286 | |
| asubramanian-gatk | INDEL | D16_PLUS | lowcmp_SimpleRepeat_quadTR_11to50 | hetalt | 97.4555 | 96.9512 | 97.9651 | 38.5714 | 318 | 10 | 337 | 7 | 5 | 71.4286 | |
| asubramanian-gatk | SNP | tv | lowcmp_Human_Full_Genome_TRDB_hg19_150331_TRgt6_lt101bp_gt95identity_merged | * | 99.6549 | 99.6320 | 99.6779 | 64.1892 | 2166 | 8 | 2166 | 7 | 0 | 0.0000 | |
| asubramanian-gatk | SNP | tv | lowcmp_Human_Full_Genome_TRDB_hg19_150331_TRgt6_lt101bp_gt95identity_merged | het | 99.5315 | 99.5674 | 99.4957 | 65.2740 | 1381 | 6 | 1381 | 7 | 0 | 0.0000 | |
| asubramanian-gatk | SNP | tv | map_l125_m1_e0 | het | 48.5238 | 32.0561 | 99.7847 | 92.9805 | 3246 | 6880 | 3245 | 7 | 1 | 14.2857 | |
| asubramanian-gatk | SNP | tv | map_l150_m2_e0 | * | 39.2587 | 24.4386 | 99.7483 | 94.9137 | 2775 | 8580 | 2774 | 7 | 1 | 14.2857 | |
| asubramanian-gatk | SNP | tv | map_l150_m2_e0 | het | 42.5209 | 27.0270 | 99.6439 | 95.4728 | 1960 | 5292 | 1959 | 7 | 1 | 14.2857 | |
| asubramanian-gatk | SNP | tv | map_l150_m2_e1 | * | 39.5063 | 24.6305 | 99.7534 | 94.8804 | 2833 | 8669 | 2832 | 7 | 1 | 14.2857 | |
| asubramanian-gatk | SNP | tv | map_l150_m2_e1 | het | 42.7242 | 27.1911 | 99.6507 | 95.4527 | 1998 | 5350 | 1997 | 7 | 1 | 14.2857 | |
| bgallagher-sentieon | INDEL | * | map_l125_m1_e0 | homalt | 99.2502 | 99.4536 | 99.0476 | 85.8491 | 728 | 4 | 728 | 7 | 4 | 57.1429 | |
| bgallagher-sentieon | INDEL | * | map_l150_m2_e1 | homalt | 98.8855 | 99.1870 | 98.5859 | 89.3019 | 488 | 4 | 488 | 7 | 4 | 57.1429 | |
| bgallagher-sentieon | INDEL | D16_PLUS | lowcmp_AllRepeats_lt51bp_gt95identity_merged | hetalt | 97.7023 | 95.9815 | 99.4860 | 36.7100 | 1242 | 52 | 1355 | 7 | 7 | 100.0000 | |
| bgallagher-sentieon | INDEL | D16_PLUS | lowcmp_Human_Full_Genome_TRDB_hg19_150331_TRgt6_lt101bp_gt95identity_merged | * | 99.3337 | 99.5146 | 99.1536 | 70.9926 | 820 | 4 | 820 | 7 | 1 | 14.2857 | |